AI Infographics
Overview
- Transform complex data into engaging visuals instantly using AI-powered text-to-infographic conversion
- Visualize customer journeys and marketing funnels clearly through specialized templates and dynamic representations
- Track project milestones and manage tasks effectively with visual timelines and mind map creation
- Create professional presentations and reports faster by converting raw data into clear, understandable charts
- Generate social media content that stands out with platform-optimized, eye-catching infographics
- Customize every aspect of your visuals with full control over colors, fonts, and layouts to match your brand
- Simplify supply chain processes and sales pipelines through visual demonstrations that clarify complex concepts
- Export ready-to-use infographics in multiple formats including PNG, JPG, and SVG for any platform
Pros & Cons
Pros
- Instantly transforms text to infographics
- High-quality visuals generation
- Fully customizable infographics
- Represents various data types
- Visualizes customer journeys
- Showcases sales conversions
- Highlights marketing funnels
- Illustrates cyclic processes
- Steps-by-step journeys visualization
- Creates hierarchy charts
- Displays timelines
- Improves communication and collaboration
- Displays project milestones
- Task management visualization
- Demonstrates sales pipelines
- Visualizes project management steps
- Depicts supply chain processes
- Simplifies complex data
- Instant idea communication
- Generates blog-supporting infographics
- Creates presentation visuals
- Suitable for reports
- Social media content enhancement
- Funnel diagrams visualization
- Cyclic process charts
- Step-by-step journeys breakdown
- Hierarchy charts from text
- Roadmaps for project tracking
- Mind maps generation
- Actionable items listicles
- Pipeline concepts demonstration
- Boosts presentations impact
- Optimal for report infographics
- Blog visuals enhancement
- Social media optimized designs
- Documentation simplification
- Exports in PNG, JPG, SVG
- Easy sharing across platforms
- Flexible canvas for design
- Branding customization
- Edits style and variations
- Affordable pricing plans
- Free version available
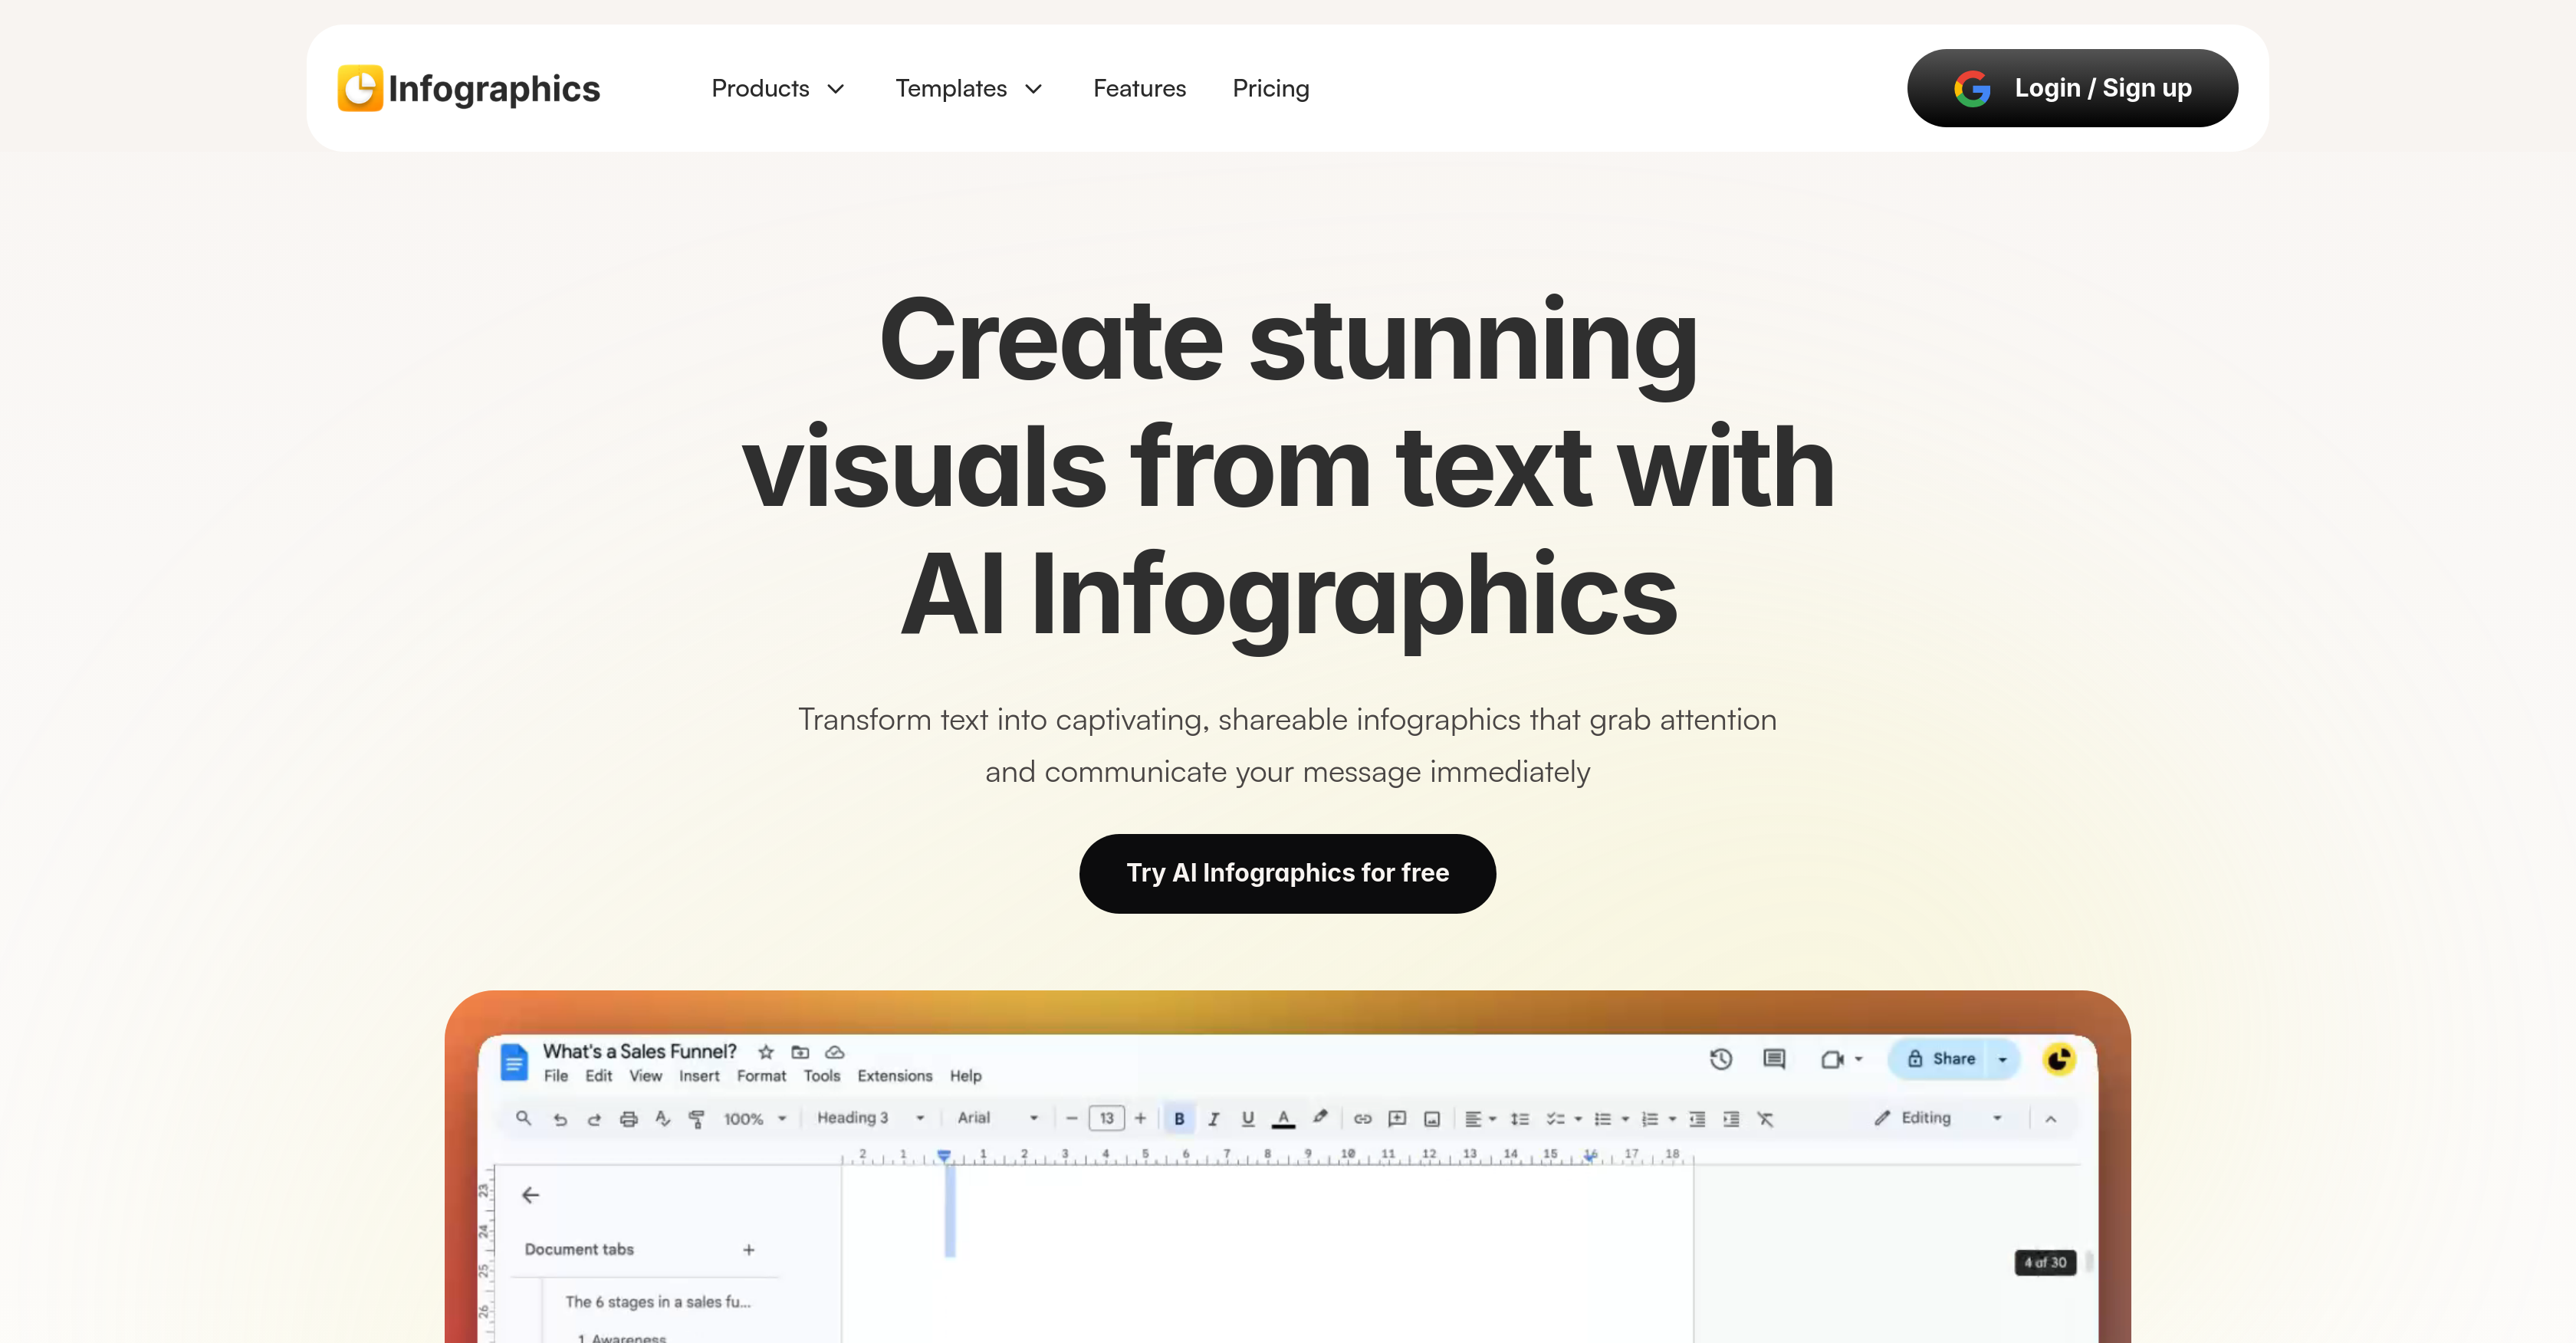
- Compatible with Google Docs
- Unlimited generations & customization
- Customized branding
- 24/7 support
- Advanced template options
- Watermark-free content
Cons
- Compatibility not specified
- Limited template options
- Premium for advanced customization
- No multilingual support
- Data security not mentioned
- Text input only
- Limited export formats
- No offline mode
- Doesn't mention mobile compatibility
Reviews
Rate this tool
Loading reviews...
❓ Frequently Asked Questions
Infographics AI is an AI-powered tool made to transform text into high-quality, understandable infographics. It facilitates the creation of unlimited, fully customizable visuals from a single-click command which can be used for diverse purposes such as presentations, blogs, reports, and social media content.
Infographics AI can produce a range of visual content including customer journeys, sales conversions, marketing funnels, cyclic processes, step-by-step journeys, hierarchy charts, timelines, project milestones, task management in the form of mind maps or numbered listicles, and concepts like sales pipelines, project management, and supply chain processes.
Infographics AI uses advanced algorithms to analyze the input text and understand its content. The software then processes this information, leveraging its vast database of visual templates and infographic elements to create high-quality visuals that perfectly encapsulate the communicated idea.
Infographics AI can visualize a wide array of data types. It can represent customer journeys, sales conversion rates, marketing funnels and more. The tool is also useful for representing cyclic processes, hierarchy charts, timelines, roadmap tracking and even sales pipelines or supply chain processes.
Infographics AI fosters better communication and collaboration by providing a visual representation of complex data and concepts. By presenting information visually, comprehension becomes quicker and easier, thus saving time, reducing misunderstandings, and making collaboration smoother.
Yes, Infographics AI has the inherent ability to display and track project milestones. These can be visually represented on timelines or roadmaps, facilitating project management by providing a clear view of the project’s progress over time.
Infographics AI excels at task management by allowing users to create mind maps or numbered listicles. This visual representation can be helpful in managing tasks, planning projects, and strategizing effectively, allowing for greater clarity and more efficient execution of tasks.
Infographics AI can easily visualize sales pipeline data. It achieves this by creating a visual demonstration of the sales pipeline, which helps in understanding the progression from lead generation to sales closure. This can be crucial for developing effective sales strategies.
Yes, one of the core strengths of Infographics AI is its ability to take complex data and simplify it into engaging, understandable visual representations. It makes data more accessible to a wider audience and helps to communicate complex ideas, trends, or processes in an easy-to-understand format.
Absolutely, Infographics AI is highly useful for creating compelling social media content. It turns insights into eye-catching graphics, designed to grab attention, increase shares, and strengthen an online presence. The designs are optimized for various social media platforms, assisting in standing out from crowded feeds.
Yes, the output of Infographics AI is fully customizable. Users have the flexibility to adjust colors, fonts, and layouts of the AI-generated infographics to match their brand or project requirements. This enables unique infographic creation according to one's specific needs.
Infographics AI has specialized capabilities that make visualizing marketing funnels and customer journeys effortless. It offers tools and templates that allow for dynamic representation of customer interactions and the stages in a sales or marketing funnel, consequently aiding in better conversion strategy formulation and understanding of the customer journey.
Yes, Infographics AI can certainly generate infographics for blog posts. It helps to enhance blog content by creating AI-generated visuals that have a stronger impact on readers, making the content more shareable and increasing engagement through comprehensible diagrams and illustrations.
Infographics AI offers a variety of professionally designed templates that users can select from. After selecting a template, users can bring their data, and AI will structure this data into a clear layout. As a result, users do not start from scratch but have a starting point which they can then customize as per their needs.
Infographics AI has features specifically aimed at enhancing presentations. It allows for the transformation of complex data into easy-to-understand visuals, thereby making presentations clearer, more engaging, and impactful. This can be particularly beneficial when creating reports, attending meetings, or during sales pitches.
Absolutely, Infographics AI has the capabilities to visually demonstrate complex concepts like supply chain processes. By offering a visual representation of these processes, the user can gain a clearer understanding and more effectively manage and optimize their supply chain.
Yes, Infographics AI aids in documenting reports by turning raw data into clear visuals. Using AI-generated charts and diagrams, it simplifies data, making reports and documentation easier to understand for teams, clients, and stakeholders. This fosters better comprehension and communication among all parties involved.
Yes, Infographics AI does support task management via its AI-generated visuals. For instance, it enables the creation of mind maps, a valuable tool in project planning and task management. By visually showcasing tasks, assignments become understandable and manageable, thus improving overall project planning and execution.
Infographics AI effortlessly handles the creation of hierarchy charts. With its AI capabilities, it can visualize text that represents data ranging from biggest to smallest or most important to least important and vice versa, providing clear and comprehensible hierarchy charts.
Infographics AI offers flexible export options for generated infographics. Users can download their custom infographics in several formats including PNG, JPG, or SVG. This wide-ranging export capability ensures the infographics are readily usable across multiple platforms.
Pricing
Pricing model
Free Trial
Paid options from
$5/month
Billing frequency
Monthly
Refund policy
No Refunds
Related Videos
Design Stunning Infographics for FREE | AI Tools You Need #ai #aitools #infographic #designwithai
Alamin•8.4K views•Apr 15, 2025