

Ask the Grid
Overview
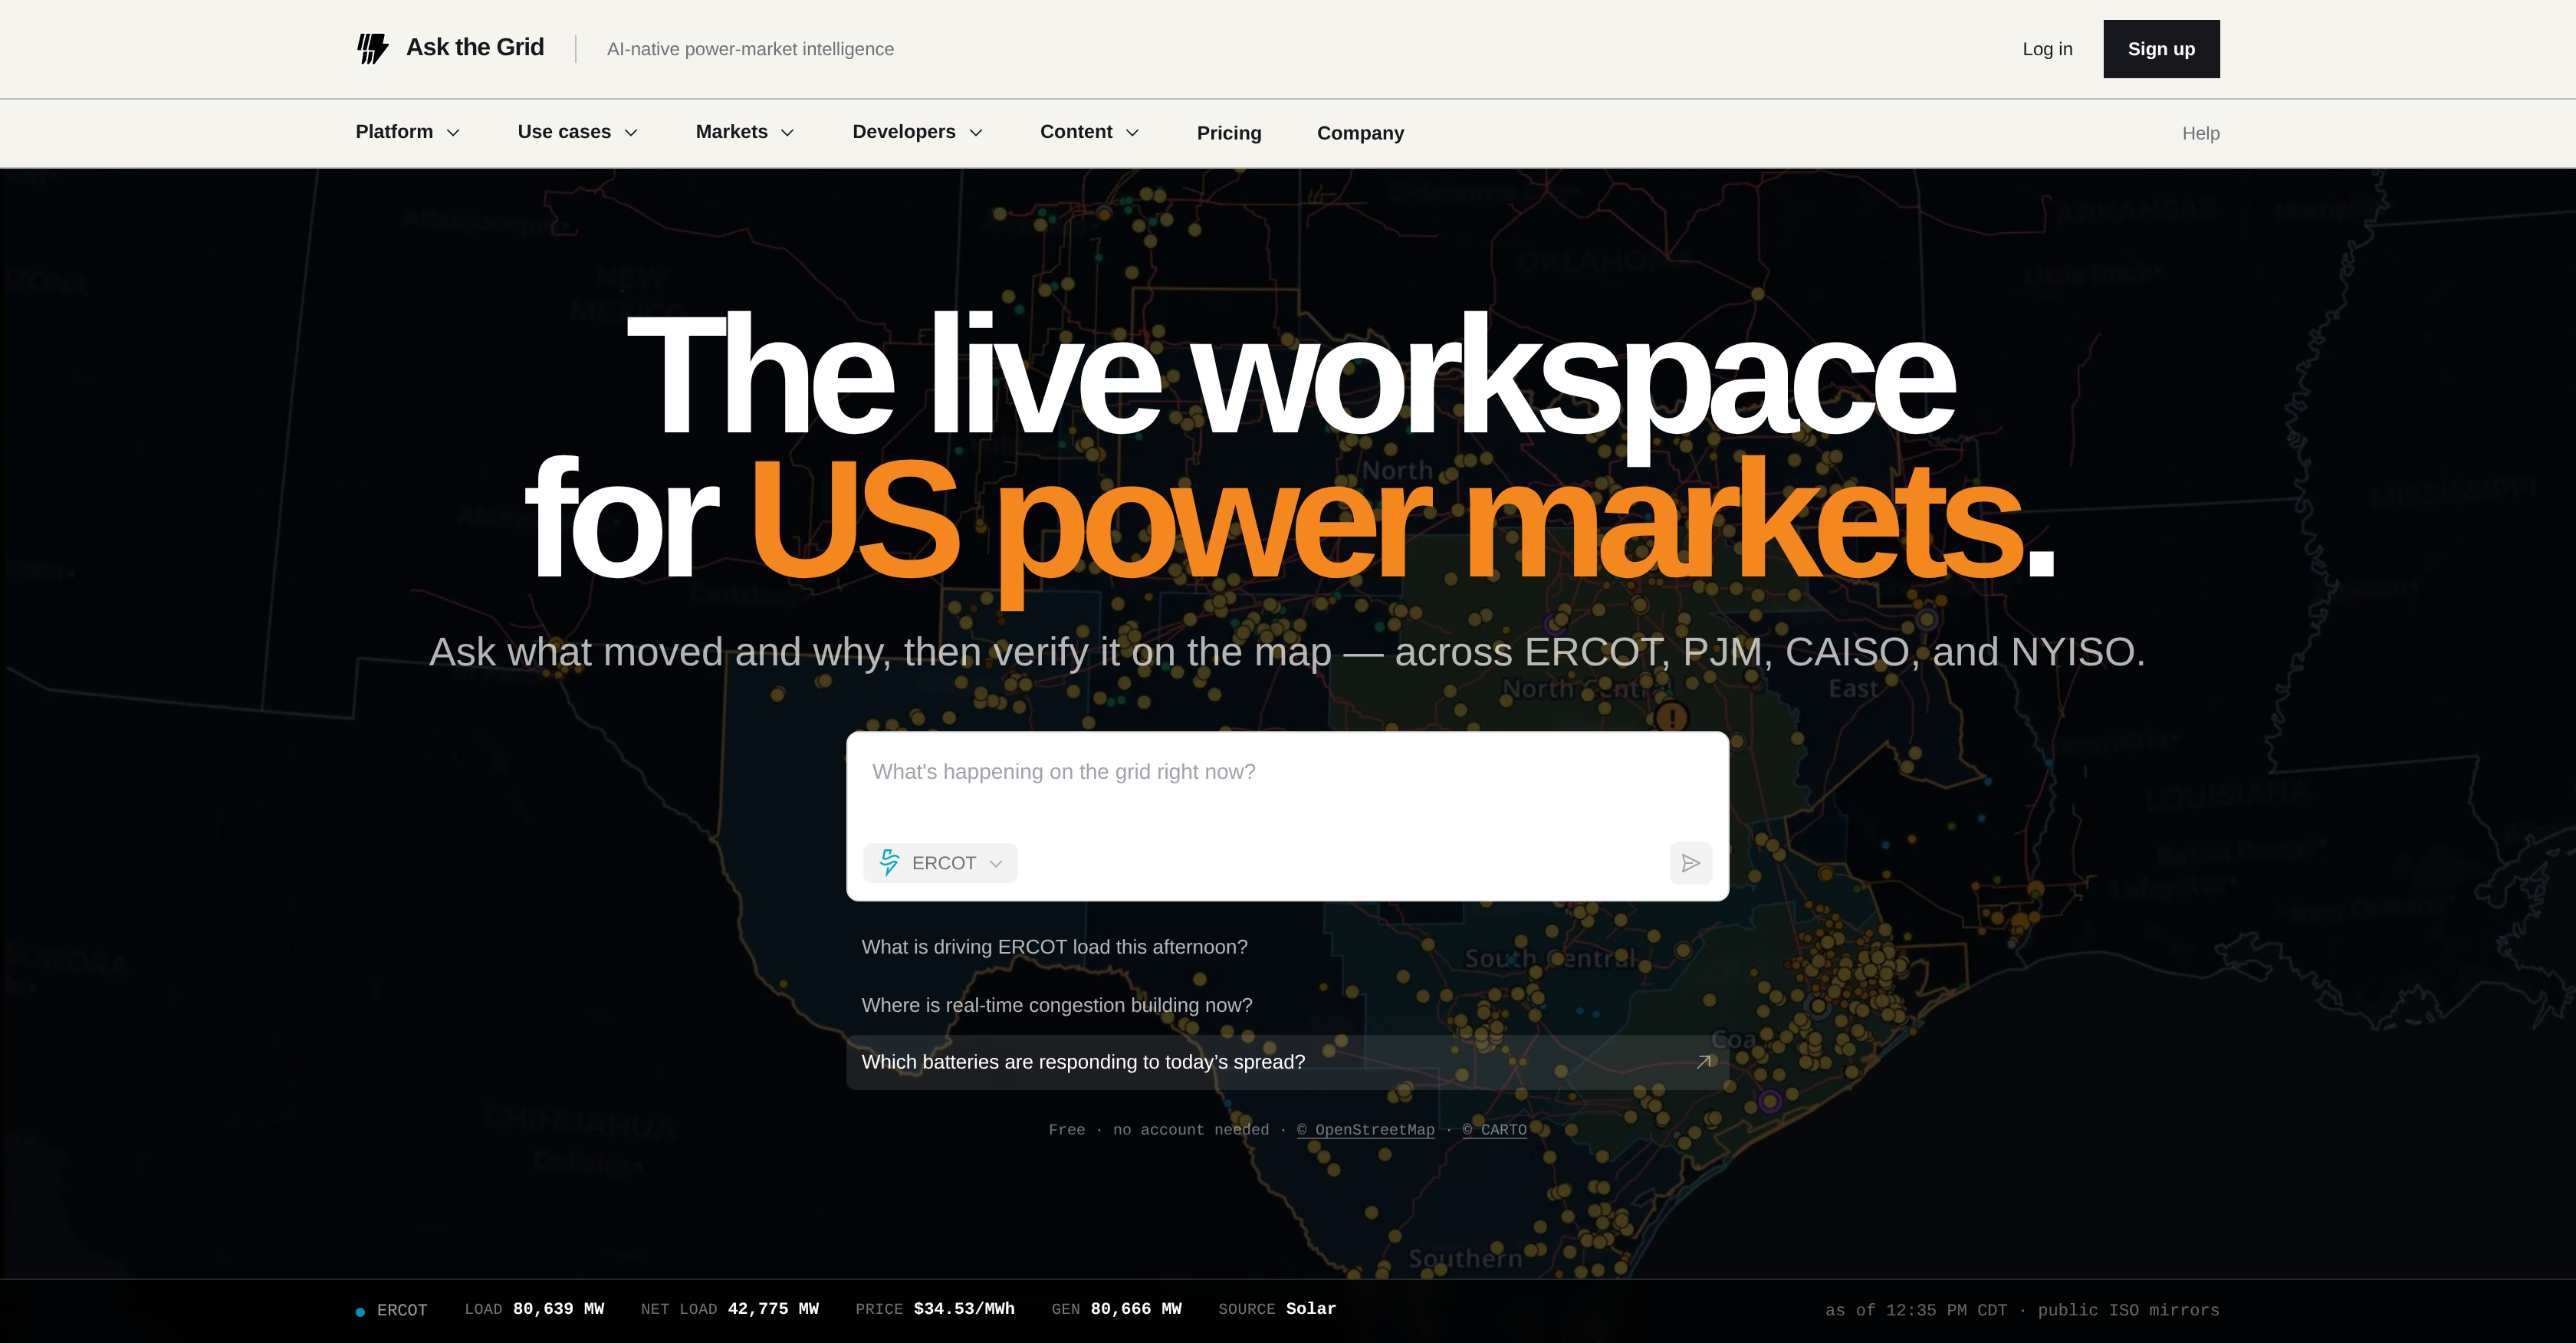
- Instantly understand why grid events happen across ERCOT, PJM, CAISO, and NYISO—ask questions and get data-backed answers with source references.
- Monitor live market conditions from load to congestion on an interactive US power grid map, powered by real-time Intelligent System Operator data.
- Layer zones, price nodes, transmission, generation, outages, and weather over the map to uncover the full context behind market shifts.
- Stay ahead of price and asset movements with custom alerts that deliver evidence-backed notifications when conditions change.
- Explain complex US power market dynamics confidently—every AI response includes source data for verification and stakeholder reporting.
Pros & Cons
Pros
- Real-time grid monitoring
- Interactive map features
- Detailed research desk
- In-depth dynamic analysis
- Intelligent System Operator data
- Explains market dynamics
- Data layering capability
- Alert system integration
- Price nodes information
- Transmission and generation info
- Outage tracking feature
- Weather overlay option
- Customizable alert conditions
- Attached evidence in alerts
- Specific for US power market
- Asset tracking feature
- Visualized load to congestion data
- Understanding of grid events
- Detailed responses to queries
- References attached to responses
- Embedded source data
- Enhanced grid analysis depth
- Additional data layering options
- Grid congestion visibility
- Dynamic real-time updates
- Plain-English question answering
- Evidence keeping feature
- Public ISO mirror integration
- Data-linked answer generation
- Live conditions tracking
- Forecast inclusion
- Personal asset lodging ability
- Private telemetry integration
- Commercial context inclusion
- Interrogating map features
- Event-based email alerts
- Underlying live grid research
- Identifiable public record use
- Reconstructed market claims
- Operating dataset assimilation
- Asset, interval, price alignment
- Sourced, period, method, limits publishing
- Non-discrepant system representation
- ChatGPT, Claude, Cursor, Codex compatibility
- Source-aware grid access
- MCP endpoint per market
- No account required for access
- Free public product availability
- Detailed, interactive field notes
Cons
- Limited to US power grid
- No support for non-English queries
- Alert system potential email spam
- No interoperability with other platforms
- No mobile application
- Complexity for non-technical users
- Only supports specific market models
- No local data storage
- Restricted data layering options
- Dependent on public ISO data
Reviews
Rate this tool
Loading reviews...
❓ Frequently Asked Questions
Ask the Grid is a dynamic real-time tool for maintaining an interactive map and a cutting-edge research desk for the United States power grid. It functions as an AI-powered platform that allows users to monitor events and understand the reasons behind specific dynamics across various power grid systems.
Ask the Grid offers a real-time, live map of the US power grid, allowing users to monitor the grid's activities from load to congestion. It provides users with a comprehensive understanding of grid dynamics across ERCOT, PJM, CAISO, and NYISO sections. Users can ask questions about grid events or changes and receive data-backed responses.
Yes, Ask the Grid can answer specific questions about the power grid. It employs an AI mechanism that responds to user inquiries about events or changes on the grid. These responses are thorough, providing detailed answers complete with references to the source data.
Yes, Ask the Grid provides real-time data. The platform offers a live market map of the US power grid and bases its answers to user inquiries on real-time Intelligent System Operator data, ensuring that the information provided is current and timely.
Ask the Grid offers an alert system that can monitor changes in prices, assets, or locations. Users can set conditions, and the alert system sends notifications when changes occur. These alerts are comprehensive, complete with the evidence attached to each alert.
Yes, users can add additional data layers to the Ask the Grid map. The platform allows the layering of extra details like zones, price nodes, transmission, generation, outages, and weather over the geographical map, thereby enhancing the depth and detail of grid analysis.
Ask the Grid helps users understand US power market dynamics by offering a live, interactive map of the power grid, coupled with an AI-backed research desk. It presents a comprehensive insight into the factors driving grid dynamics across different regions and helps users dig deeper into grid events, changes, and trend analysis, contributing significantly to understanding US power market movements.
Yes, Ask the Grid offers a visual representation of power grids. It presents a live market map of the US power grid that users can interact with to understand various dynamics across different regions from load to congestion. Users can add layers of extra data to this map, enhancing their grid analysis further.
Yes, Ask the Grid can explain events or changes on the US power grid. Its AI mechanism allows users to ask questions about any grid event or change, to which it responds with detailed, source-referenced answers. This feature enables the users to understand and explain the reasons behind various market shifts.
Yes, Ask the Grid covers regions like ERCOT, PJM, CAISO, and NYISO. Users can monitor events and understand the dynamics of these regions using the Ask the Grid interactive map and research desk.
Ask the Grid sources its data from real-time Intelligent System Operator data. This data, along with references to the source, is attached with every response given by the Ask the Grid's AI to user inquiries.
The responses provided by Ask the Grid are detailed and come attached with references to source data. These references offer evidence behind each explanation and are designed to provide comprehensive, data-driven answers to user inquiries.
Yes, Ask the Grid can analyze power grid outages. Its platform enables addition of outage data as a layer over its live geographical map, allowing users to monitor and analyze current and potential outages in the grid.
Ask the Grid's alert system allows users to set conditions on prices, assets, or locations. It continuously evaluates these conditions and sends alerts to the users when changes occur. These alerts come complete with attached evidence, providing the users with a thorough understanding of each change.
Entities needing to explain or understand the US power market dynamics stand to benefit the most from using Ask the Grid. This includes, but is not limited to, power system operators, energy market analysts, utility companies, and energy traders.
Yes, Ask the Grid offers weather overlays for the grid map. Users can add a weather layer to the geographical map to gain insights into how weather conditions across various zones affect the power grid
Yes, Ask the Grid can track assets. It has an alert system that monitors changes in assets. Users can set conditions for these assets, and the system sends alerts when these conditions are met or changes occur.
Yes, additional data like price nodes, transmission, and generation can be overlaid on Ask the Grid's map. It enables layering of these elements over the geographical map, thereby enhancing the users' ability to analyze and understand grid dynamics across various zones.
Yes, Ask the Grid maintains real-time Intelligent System Operator data that it uses as the basis for its AI responses to user inquiries. This data implements a real-time understanding of the power grid's condition, allowing Ask the Grid to provide timely and accurate information.
Ask the Grid, with its AI mechanism and interactive interface, enables users to ask questions regarding market changes and get detailed responses. The responses are backed by Intelligent System Operator data, and explain the reasons behind the changes. This feature allows users to effectively understand and further explain market dynamics.
Pricing
Pricing model
Free
Paid options from
Free