

Overview
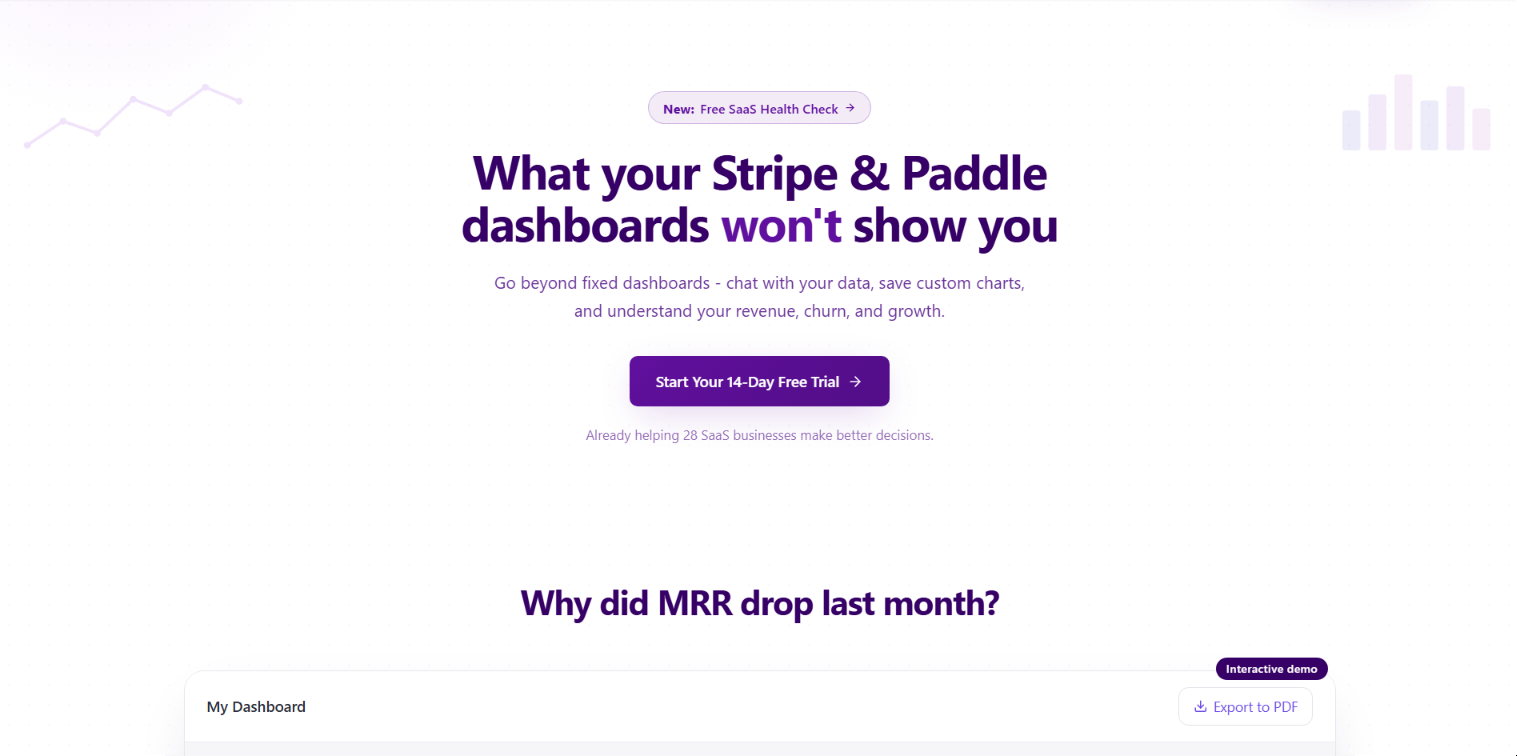
- Understand exactly why churn spiked or which customers drive revenue by asking plain English questions—Chartsy’s AI analytics engine generates instant charts and explanations from your subscription data.
- Spend zero time building or filtering dashboards and get pre-built analytics for MRR, ARR, churn, retention, LTV, failed payments, refunds, and plan performance the moment you connect Stripe or Paddle.
- Uncover hidden patterns in your business by analyzing custom metadata like customer type, location, or acquisition channel—Chartsy turns saved metadata into actionable subscription analytics.
- Track how recurring revenue changes month over month with a dedicated MRR dashboard that breaks down upgrades, downgrades, new subscriptions, churn, reactivations, and expansion revenue.
- Export polished PDF reports and high-quality PNG charts directly for investor meetings or stakeholder presentations—no extra design work needed.
- Get a daily briefing of your most important SaaS metrics and what changed, delivered as a message inside Chartsy, so you never miss a revenue shift.
Pros & Cons
Pros
- Customizable analytics dashboard
- Natural language data queries
- Automated data analysis
- Calculates desired metrics
- Auto-selection of visualizations
- Tracks fundamental SaaS metrics
- Produces financial reports
- Stripe and Paddle integration
- Built-in templates
- Chat assistant for data
- Metadata and revenue analytics
- E-commerce analytics
- Real-time insights
- Export & share feature
- Customizable dashboards
- Team collaboration feature
- Secure one-click integrations
- Supports BigCommerce analytics
- Real-time data sync
- Subscription metrics & insights
- Product & revenue analytics
- Real-time sales tracking
- Track revenue trends
- Average order value analytics
- Customer behavior analytics
- SaaS and e-commerce integrations
- No SQL or formulas
- Instant intelligent visualizations
- Downloadable reports as PDFs
- Exportable charts as PNGs
- Seamlessly connect with Paddle
- No rigid templates
- Live sharing of dashboards
- Supports multiple integrations
- Boardroom-ready visualizations
- Track MRR, churn, subscription
- Track products, revenue trends
- Secure API connection
- More e-commerce integrations coming
- Transforms payment data
Cons
- Limited integration options
- No API mentioned
- Limited to SaaS businesses
- Lack of coding interface
- No offline mode
- No direct SQL queries
- Not suitable for non-subscription businesses
- Missing multi-language support
- No multi-platform support
Reviews
Rate this tool
Loading reviews...
❓ Frequently Asked Questions
Chartsy is a specialized analytics tool designed for Software as a Service (SaaS) businesses. It enables users to create customizable analytics dashboards and interact with data using natural language queries. It aims to provide a comprehensive view of key performance metrics, moving beyond the capabilities of traditional payment dashboards such as Stripe or Paddle.
Chartsy's key features include: SaaS analytics, the capability to interact with data using natural language queries, customizable subscription analytics dashboards, built-in templates, a chat assistant for data interaction, metadata and revenue analytics, automation of data analysis tasks, data visualization, financial reporting, churn tracking, growth trends tracking, and the ability to integrate with Stripe or Paddle.
Chartsy helps SaaS businesses by providing a comprehensive view of key performance metrics like Monthly Recurring Revenue (MRR), churn, growth trends, and more. It automates data analysis tasks by allowing users to interact with their data using natural language queries, thus eliminating the need for extensive coding knowledge. It also allows for easy integration with Stripe or Paddle, providing quick insights into revenue and customer dynamics.
Chartsy integrates with Stripe and Paddle via a straightforward process. Once connected, Chartsy can sync data and provide real-time revenue and subscription analytics. This helps businesses in tracking key metrics like MRR, churn, and subscription metrics instantly.
Yes, Chartsy lets users create a customizable subscription analytics dashboard tailored to their needs. It is not fixed to rigid templates and allows for personalized metrics and visualizations, thus facilitating the creation of the exact type of dashboard a business needs.
The natural language queries in Chartsy are a feature that allows users to interact with their data in a conversational mode, asking any question about their data. Chartsy then responds by calculating the desired metrics, automatically selecting the correct visualizations, and providing insights in an understandable format.
Chartsy tracks Monthly Recurring Revenue (MRR) by automatically syncing payment data from Stripe or Paddle once the accounts are connected. It then calculates and displays MRR along with other important SaaS metrics.
Chartsy can visualize a wide range of data types. This includes key SaaS metrics like Monthly Recurring Revenue, churn rate, and growth trends. Additionally, it can create visualizations around Subscription Business Metrics, E-commerce Analytics, and other data derived from integrations with Stripe, Paddle, or BigCommerce.
Yes, Chartsy can produce financial reports for stakeholders. It has a built-in exporting feature that allows users to download beautiful reports as PDFs or export individual charts as high-quality PNGs. These can be used for presentations and meetings.
No, Chartsy does not require coding knowledge to operate. Its design enables users to interact with their data using natural language queries, automating data analysis tasks. More sophisticated queries and data manipulations previously requiring coding can now be navigated conversationally.
Chartsy automates data analysis tasks by allowing users to interact with their data using natural language queries. Users can ask any question about their data, and Chartsy calculates the desired metric and automatically selects the appropriate visualizations, thereby bypassing manual data analysis and number crunching.
Chartsy's chat assistant feature is a facet of its ability to handle natural language queries. Users can chat with their SaaS data, asking questions and getting instant, intelligent visualizations and insights. This feature helps automate data analysis tasks and makes interacting with data more intuitive.
Chartsy handles metadata and revenue analytics by using Artificial Intelligence to transform both Stripe and Paddle data into actionable insights. This helps businesses in tracking key performance metrics and understand their revenue and customer dynamics.
Chartsy offers built-in templates that allow users to build personalized dashboards with the exact metrics and visualizations they need. These are designed to be flexible, unlike traditional rigid templates, granting users more freedom and customization options.
Yes, you can export data from Chartsy. It has a built-in exporting feature that allows users to download reports as PDFs or export individual charts as high-quality PNGs for presentations and meetings.
Growth trends tracking in Chartsy works by analyzing and visualizing key SaaS metrics and trends over time. By connecting Stripe or Paddle accounts, real-time data is used to present growth trends that assist in tracking and understanding business performance.
The data interaction feature of Chartsy pertains to the natural language queries functionality. It allows users to interact with their data in an intuitive way, asking questions and getting instant visualizations and insights. This feature streamlines data analysis and makes understanding complex metrics easier.
Chartsy differs from traditional payment dashboards as it provides a more comprehensive view of key business performance metrics. While traditional dashboards might focus purely on payments, Chartsy goes beyond by enabling users to interact with their data using natural language queries, visualizing a whole range of essential SaaS metrics, automating data analysis tasks, and offering customizable analytics dashboards.
Yes, Chartsy can analyze customer dynamics. It does so by providing insights from Stripe and Paddle data once connected, including tracking MRR, churn, revenue trends, top products, customer behavior, segmentation, and more. This allows businesses to understand their customers better and make more informed decisions.
Pricing
Pricing model
Free Trial
Paid options from
$29/month
Billing frequency
Monthly
Refund policy
14
Related Videos
Which payment provider should you choose? - Chartsy's new free tool
Serena•8 views•Jul 8, 2026