
Overview
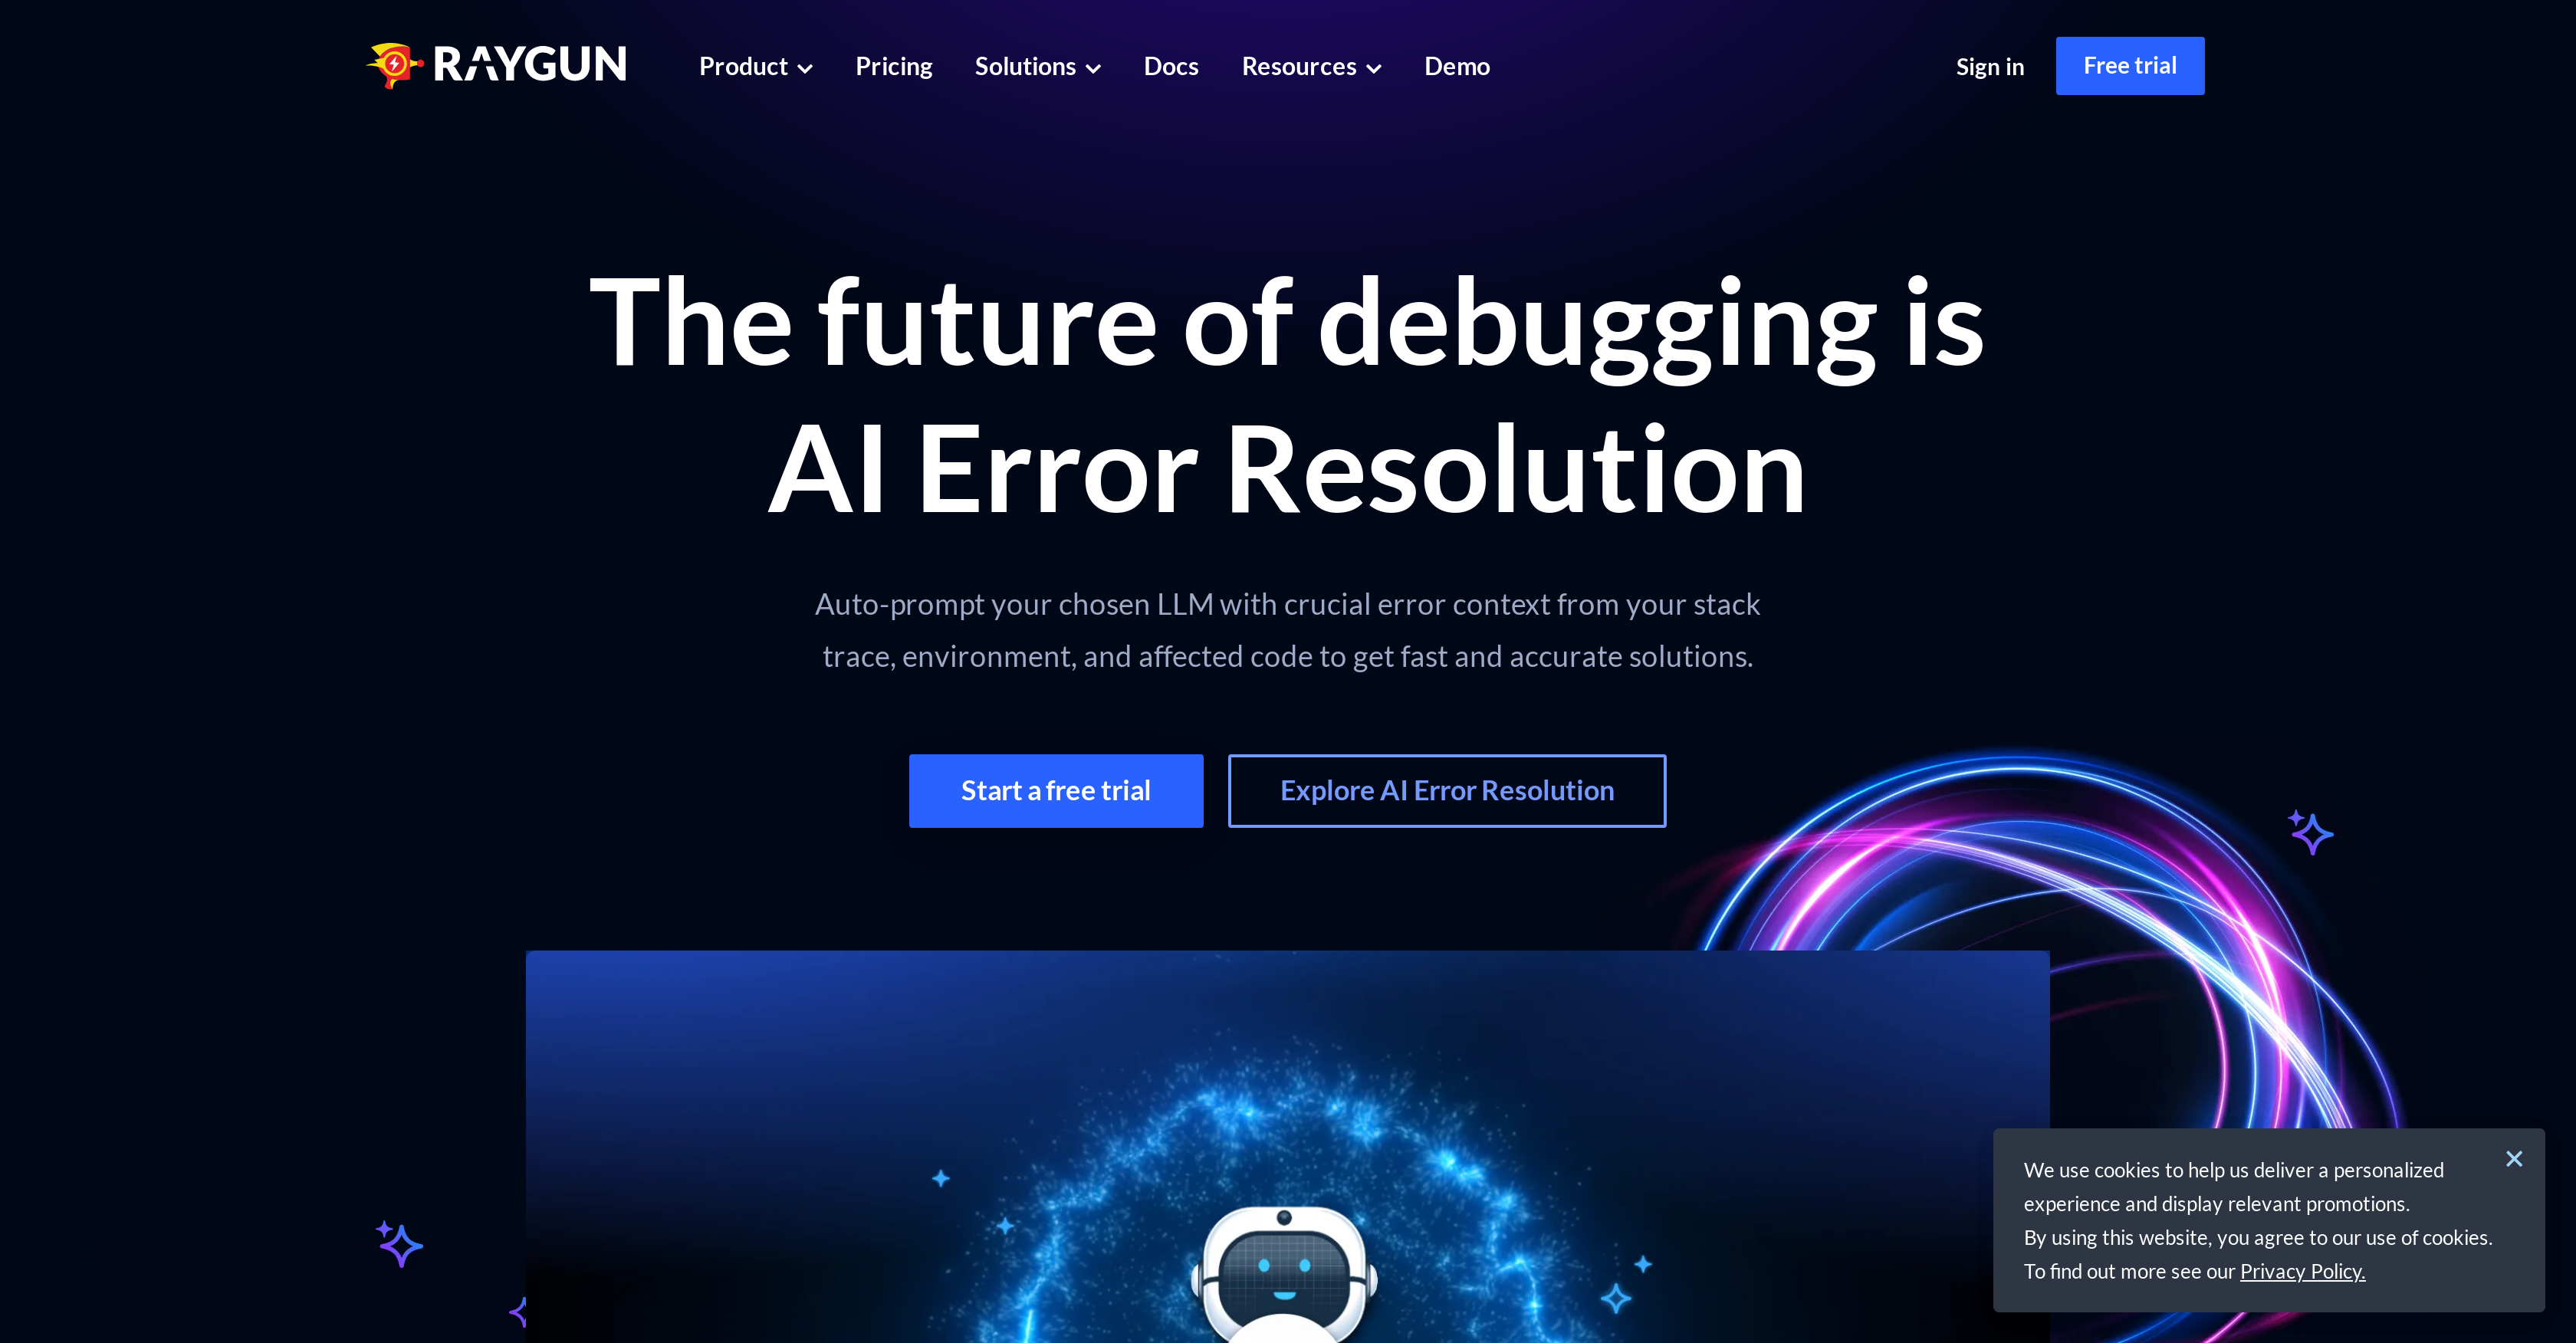
- Fix software errors in minutes instead of hours with AI-powered error resolution that analyzes patterns and recommends specific solutions
- Maintain optimal application performance with real user monitoring that tracks page load times, network latency, and browser rendering speed
- Prevent revenue loss from crashes with automated crash reporting that detects, diagnoses, and resolves errors before they impact users
- Understand exactly how code changes affect performance through deployment tracking that connects releases to user experience metrics
- Build personalized monitoring views with customized dashboards that highlight the specific performance data most relevant to your team
- Streamline your workflow through seamless integrations with Slack, Jira, GitHub and other development tools
- Pinpoint server-side bottlenecks with application performance monitoring that provides comprehensive visibility into backend operations
- Monitor critical user experience metrics with detailed web vitals tracking including time to interactive and first input delay
Pros & Cons
Pros
- Web and mobile monitoring
- Insightful user experience data
- Critical crash reporting
- Real user monitoring
- Application performance monitoring
- Alerting tools
- Customized dashboards
- Range of integrations
- Customer-experience monitoring
- Deployment tracking
- Supports various industries
- Robust API
- Detailed web vitals monitoring
- Capabilities for different roles
- Deployment frequency acceleration
- Code-level context for traces
- Multithreaded trace support
- Data-driven back-end monitoring
- Compatible with popular platforms
- Granular diagnostics
- Flexibly scaled
- Encrypted data storage
- Compliance with security standards
- First-class language/framework support
- Core web vitals tracking
- Root cause analysis
- Crash-free users
- Content security policy tools
- On-demand pricing
- Shopify, Azure, Heroku solutions
- Lightweight SDKs
- In-app chat support
Cons
- No offline functionality
- Limited customizing dashboards
- Humongous data may slow
- No multi-tenant support
- Limited mobile monitoring capabilities
Reviews
Rate this tool
Loading reviews...
❓ Frequently Asked Questions
Raygun is an application monitoring tool designed for both web and mobile apps. It offers insights into how users are experiencing your software applications and aids in detecting, diagnosing, and resolving issues that affect end users.
Key features of Raygun include crash reporting for easy detection, diagnosis, and resolution of errors, real user monitoring to improve front-end performance, application performance monitoring for visibility into server-side performance, AI-based error resolution, and alert tools. It also includes customer-experience monitoring, deployment tracking capabilities, detailed monitoring of web vitals, and a robust API for implementation needs. Raygun supports customized dashboards and offers a range of integrations.
Raygun's real user monitoring works by tracking the actual experience of users on your web or mobile app. It monitors usage patterns, response times, and other performance metrics relevant to the user experience. It actively reports any bottlenecks or issues that impact the user experience, enabling proactive issue resolution.
Raygun's crash reporting tool works by automatically monitoring applications for crashes or bugs. Whenever a crash is detected, it gathers detailed error reports and sends them to a centralized dashboard. These reports include comprehensive information that allows developers to understand, reproduce, and rectify the issue effectively.
Raygun employs artificial intelligence in diagnosing and resolving errors. The AI technology in Raygun can analyze error patterns, help identify the root cause of an issue, and recommend potential solutions. This leads to the rapid resolution of errors and overall improved application performance.
Raygun supports application monitoring for both web and mobile apps. This includes various web applications deployed across different servers and mobile applications built for various operating systems like iOS and Android.
Raygun's alerting tools work by sending notifications whenever anomalies or issues are detected in the system. These tools allow users to set up custom alert conditions, thresholds, and control how often and who gets notified. Alerts can be delivered via a variety of channels, including email and many third-party integrations.
Yes, Raygun facilitates the creation of customized dashboards. Users can create personalized views with a focus on the data they care about the most, ensuring they have quick access to the most pertinent information relating to their application's performance.
The purpose of customer-experience monitoring in Raygun is to gain insight into how users are experiencing your software application. It allows for understanding usage patterns, detecting performance issues, and identifying pain points in the user journey, which in turn aids in enhancing customers' experiences and overall satisfaction.
Raygun's deployment tracking capabilities work by tracking changes in system performance after each deployment. This feature enables users to connect the dots between deployments and fluctuations in performance, error instances, or user experience metrics, thereby providing a deeper understanding of how changes to the applications impact customer experiences.
Raygun benefits a wide variety of industries, including e-commerce, media & entertainment, and software & technology. It aids in application monitoring, tracking user experiences, resolving errors and improving overall application performance, making it a valuable tool for any industry that relies on digital platforms.
Yes, Raygun caters to different roles including developers, CTOs, and product managers. Developers can use Raygun to track and fix errors in the applications, CTOs can overlook the overall performance of the applications, and product managers can leverage it to gain insights into customer experience.
Raygun monitors web vitals in detail by continuously tracking key metrics that reflect user experience, like page load time, time to interactive, first input delay, and more. This enables the recognition of any performance issues and helps in their quick resolution, thereby enhancing the overall user experience.
Raygun has a robust API that users can make use of for various implementation needs. It provides seamless integration of the Raygun software with your applications, enabling automated data collection, and the customization and control of data ingestion.
Raygun provides detailed insights into mobile app performance. It tracks app usage, monitors and reports crashes or bugs, provides comprehensive error reports, and helps optimize the application for better user satisfaction and experience.
Raygun provides comprehensive visibility into server-side performance through its Application Performance Monitoring feature. This feature records detailed performance data for web requests, traces the cause of performance bottlenecks, and provides real-time diagnostics, enabling maintenance of optimal server performance at all times.
With Raygun's Real User Monitoring feature, you can monitor various aspects of user interactions with your application, including page load time, network latency, browser rendering speed, and more. It also provides insights into performance bottlenecks and user-specific incidents, thereby enabling improvements in front-end performance.
AI Error Resolution in Raygun employs artificial intelligence to recommend resolutions when errors occur. It analyzes stack traces and other error information to find similarities with known issues and suggests potential fixes, thereby reducing the mean time to resolution.
Raygun supports a range of integrations, enabling it to easily fit into your existing workflow. These integrations include popular third-party applications and platforms like Slack, Github, Jira, Bitbucket, and many more.
Yes, Raygun provides support for code debugging. Its crash reporting feature provides detailed error reports which include specifics about the environment and detailed stack traces. This information can make code debugging simpler and faster, thereby reducing the time and effort involved in resolving errors.
Pricing
Pricing model
Free Trial
Paid options from
$40/year
Billing frequency
Yearly