

Overview
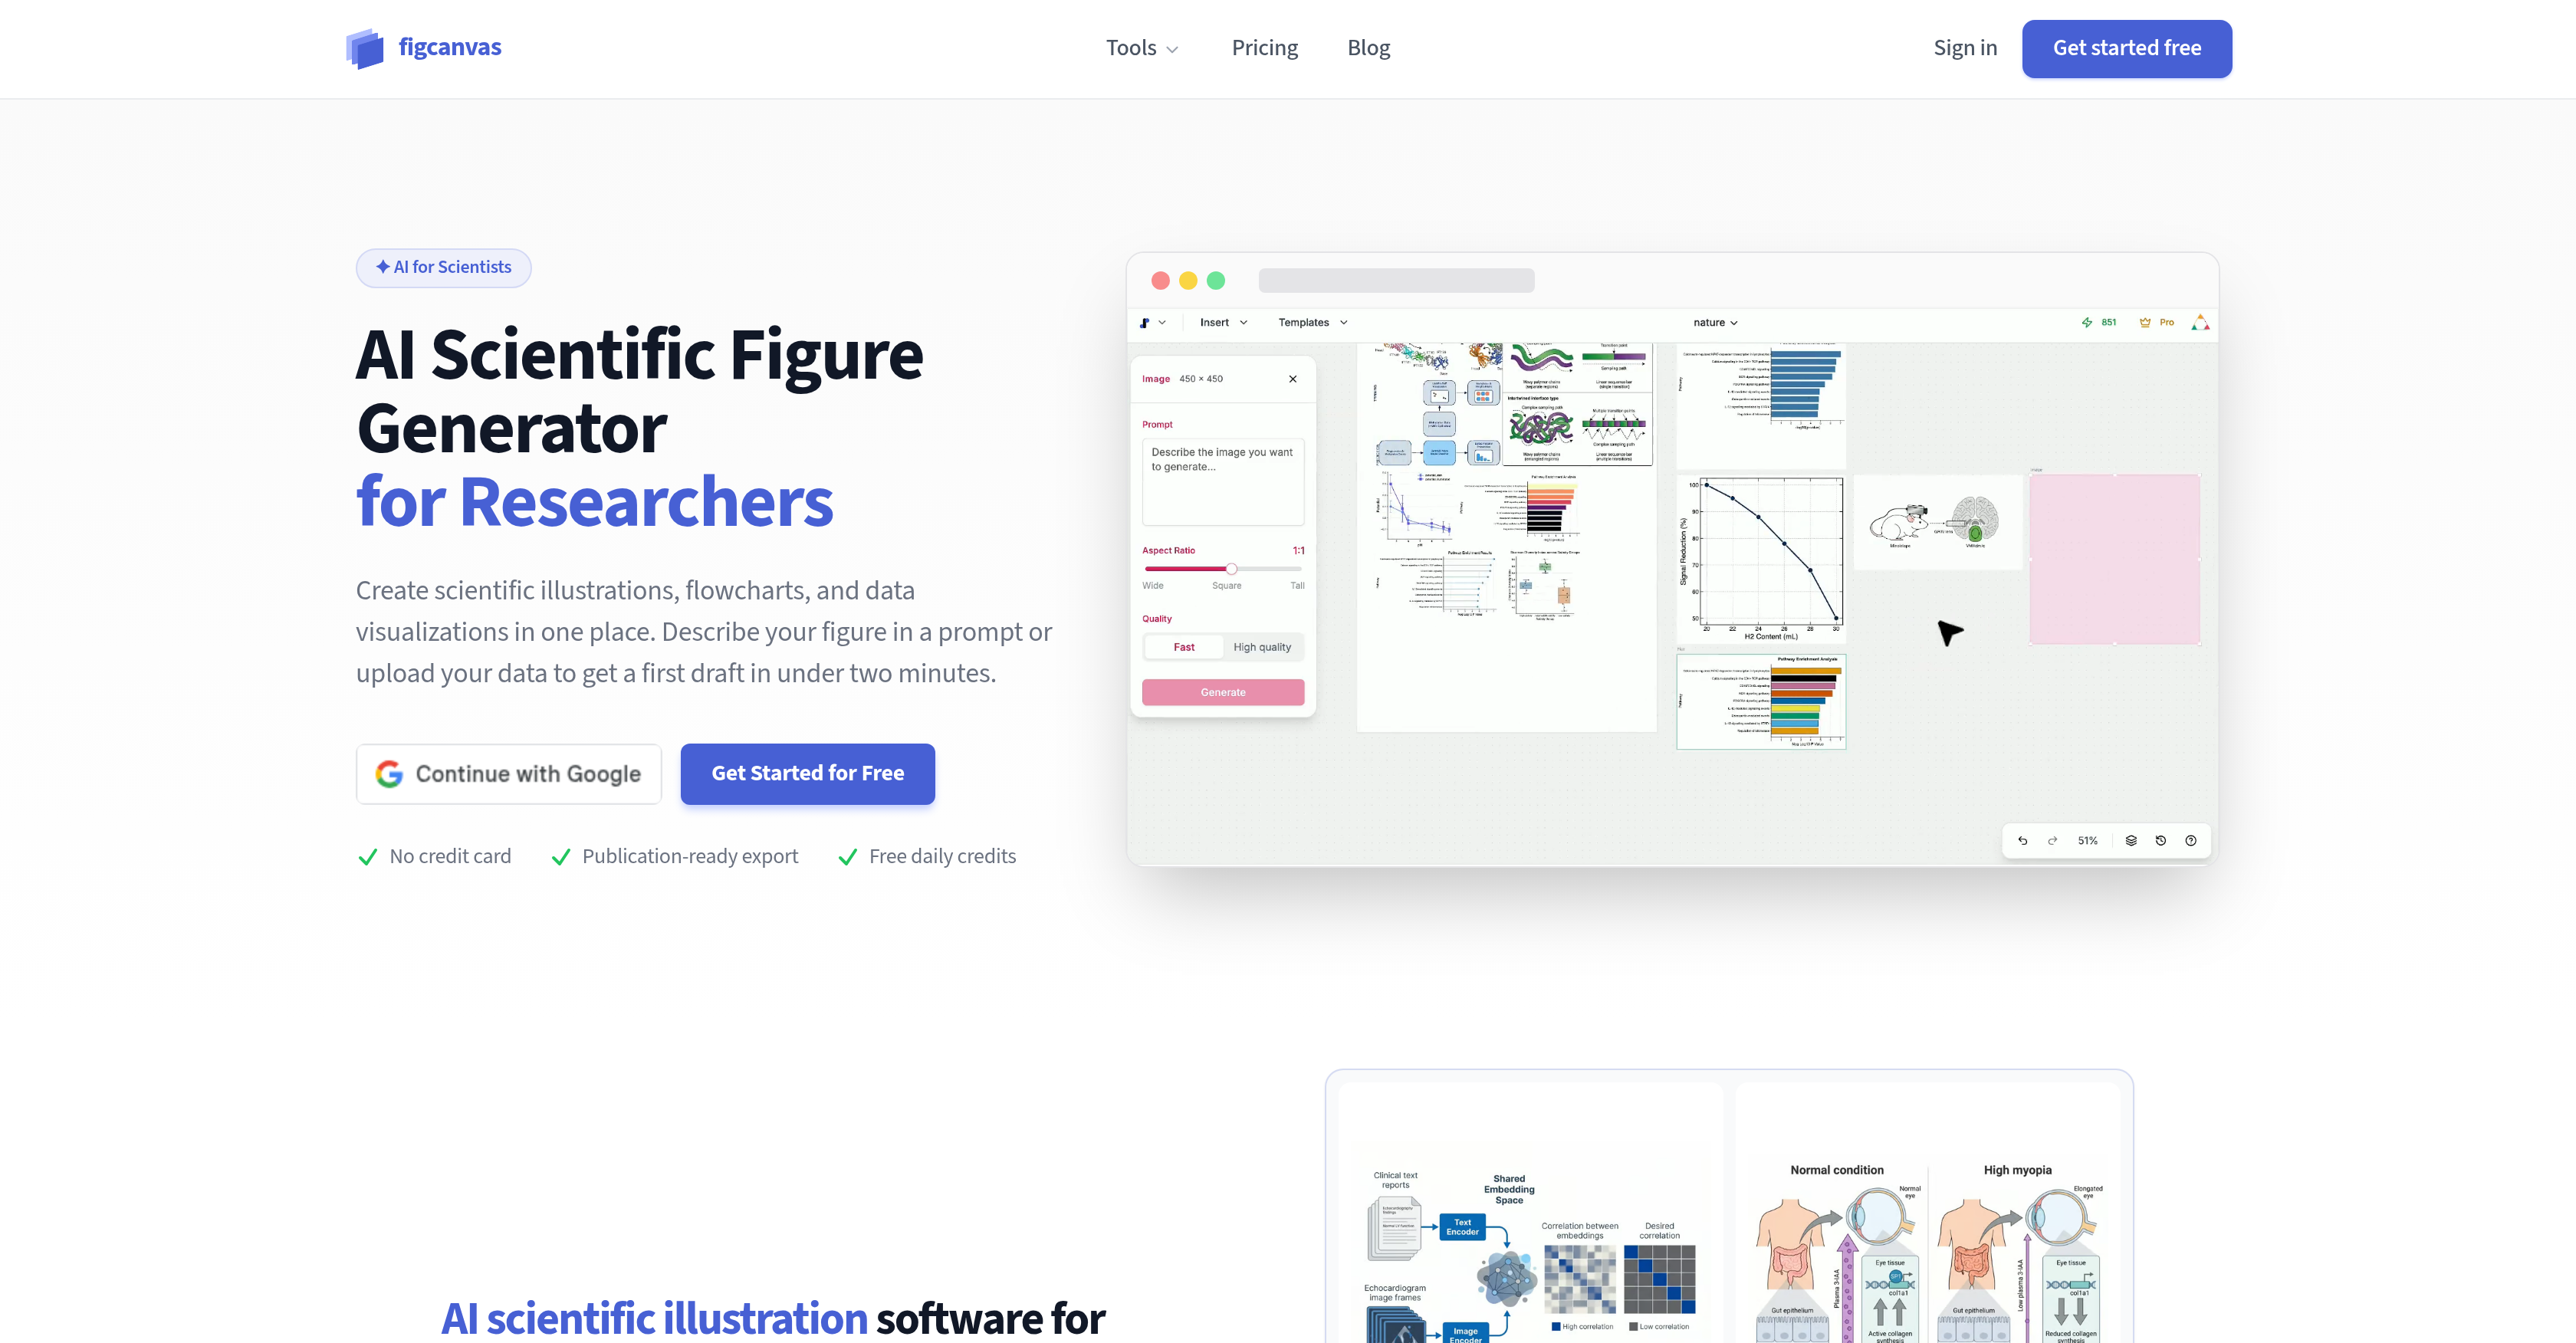
- Get a working draft of your scientific figure in under two minutes by describing your concept or uploading a dataset
- Generate publication-ready biological illustrations, pathway diagrams, and molecular mechanisms without manual drawing
- Turn raw data into volcano plots, heatmaps, PCA plots, and bar charts that are easy to read and share
- Convert methodology text into clean, editable flowcharts for experimental workflows, CONSORT diagrams, and bioinformatics pipelines
- Assemble multi-panel figures on an infinite canvas to align scientific illustrations, data visualizations, and flowcharts exactly as journals require
- Export every figure as SVG, PNG, or PDF to integrate seamlessly into manuscripts, posters, and presentations
- Edit labels, colors, text, and individual elements directly in the browser without switching to external software
- Achieve visual standards of leading science journals by using a tool calibrated from thousands of top-tier publication figures
Pros & Cons
Pros
- Generates scientific figures
- Creates scientific illustrations
- Processes raw data visuals
- Transforms text descriptions into diagrams
- Supports pathway diagrams creation
- Transforms molecular mechanisms into visuals
- Visualizes study designs
- Displays structured data values
- Features infinite canvas
- Simultaneous handling of visualizations
- Allows alignment of various figures
- Exports in SVG, PNG, PDF
- Matches top-tier journals' visual standards
- User-friendly editing
- Quick draft generation
- Converts methodology text into flowcharts
- Presents bioinformatics pipelines visually
- Facilitates experimental overviews
- Creates cell biology visuals
- Enables multi-panel figures assembly
- Generates CONSORT diagrams
- Creates editable SVG figures
- Converts raw data into figures
- Visualizes pathways, mechanisms
- Produces experiment overviews
- Functional with plain-language prompts
- Generates drafts for refinement
- Accessibility for non-coders
- Instant methodology flowchart
- Protocol text transformation
- Allows drag, align, group actions
- Smart guide for panels
- Directly editable SVG on platform
- 300 DPI PNG export
- Handles color choices, typography, layout
- Sourced color palettes from journals
- Typography matches journal style guides
- Follows chart conventions automatically
- Provides publication-ready export
- No separate tool download required
- Visualizes uploaded dataset or structured values
- Optimized for researchers
- Transforms paper summaries into figures
- Suggests best visual starting point
- One tool for all research figures
- Cheaper and faster than competition
- Free daily credits availability
- No coding required
- Faster than manual building
- Plain language figure description feature
Cons
- Lacks real-time collaboration
- Limited export formats
- No mobile application
- No offline usage
- Potential steep learning curve
- Limited customization options
- Embedding figures unavailable
- No integral reference management
- Domain-specific usability
- Not open-source
Reviews
Rate this tool
Loading reviews...
❓ Frequently Asked Questions
FigCanvas is an AI tool specifically designed to generate scientific figures. It is particularly useful for researchers in creating scientific illustrations, flowcharts, data visualizations, and in preparing scientific reports and publications.
FigCanvas generates scientific figures through its AI capabilities. The user begins by providing a plain-language prompt, methodology text, or a dataset. FigCanvas then interprets this input and swiftly generates a working draft. Users can refine labels, prompts, and layout after generation to suit their needs.
FigCanvas is capable of creating various types of visuals such as scientific illustrations, flowcharts, data visualizations. It supports the transformation of pathway diagrams, molecular mechanisms, and study designs into comprehensible figures.
The 'infinite canvas' feature in FigCanvas is a virtual workspace that allows simultaneous handling and alignment of various data visualizations, scientific illustrations, and flowcharts. This unique feature permits the arrangement of multi-panel figures in a manner that leading science journals expect.
FigCanvas supports multiple export formats which include SVG, PNG, and PDF. This enables easy integration of generated figures into diverse platforms.
FigCanvas follows the visual standards of leading science journals. It is calibrated according to what these top-tier publications consider as 'publication-ready', reflecting the conventions that real reviewers and editors look for.
FigCanvas is immensely beneficial for researchers. It helps in rapidly drafting scientific figures based on plain-language prompts or datasets. It aids in visualizing pathway diagrams, molecular mechanisms, study designs, and structured data values, thereby facilitating the creation of meaningful and clear presentations, papers or reports.
Yes, FigCanvas can accept both plain-language prompts and datasets as input. Users can begin with a simple description or upload their data, and FigCanvas will generate a clear, editable draft figure.
Yes, FigCanvas is very user-friendly. It features a solid editing capability and offers easy navigation, enabling users to refine labels, prompts, and layouts following generation.
FigCanvas is capable of generating a working draft in under two minutes, making it a highly efficient tool for researchers and scientists.
FigCanvas supports a wide array of data visualizations, from pathway diagrams, molecular mechanisms, study designs to structured data values visuals. It also turns raw data into publication-ready scientific visuals such as volcano plots, bar charts, heatmaps, PCA plots, and violin plots.
FigCanvas ensures diverse platform integration by allowing figures to be exported in multiple formats such as SVG, PNG, and PDF. This flexibility of format export guarantees that the generated figures can be easily integrated into different platforms.
Yes, FigCanvas does provide editing capabilities. Users can adjust labels, colors, text, and individual elements directly in their browser, therefore refining figures to meet their specific preferences and needs.
Indeed, FigCanvas can be used for creating flowcharts. Users can paste their methods section or protocol, and FigCanvas will then extract the steps and generate a clean, editable flowchart. This is particularly useful for depicting experimental workflows, CONSORT diagrams, and bioinformatics pipelines.
FigCanvas has capabilities for handling pathway diagrams and molecular mechanisms. Users can simply describe the action or structure they want to represent, and FigCanvas will generate a clear and concise figure that can then be refined for papers and slides.
FigCanvas is particularly useful for scientific reports and presentations because it can turn complex information into clear visual forms. It can create a wide range of visuals such as pathway diagrams, molecular mechanisms, and study design graphics. Furthermore, it offers export in multiple formats, facilitating easy integration into diverse publication and presentation platforms.
Yes, FigCanvas can transform raw data or text descriptions into visuals. It takes raw data or structured values and generates scientific visuals faster, without requiring every figure to be manually rebuilt. This feature is particularly useful for generating publication-ready figures that are easy to read and share.
FigCanvas supports research presentations by creating high-quality visuals that simplify complex scientific information. The tool's capability to transform text prompts or datasets into clear visuals significantly aids in the preparation of well-structured presentation materials.
FigCanvas is capable of creating a wide variety of study design graphics. Offering a range of scientific visualization tools, FigCanvas allows users to describe a process or visual structure they wish to depict, then generates a figure accordingly. Examples include pathway diagrams, molecular mechanisms, and study designs.
Yes, FigCanvas does offer immediate draft generation. Users can start with a plain-language prompt, methodology text, or a dataset, and FigCanvas will generate a working first draft in under two minutes. This draft can be further tweaked and refined in order to produce the final figure.
At the core of FigCanvas are three main functionalities. Users input a plain language prompt, methodology text, or dataset to create a draft figure. The AI then generates the figure which can be refined and exported in various formats such as PNG, SVG, or PDF. FigCanvas also enables the assembly of multi-panel figures using an infinite canvas for flexibility in data presentation.
Absolutely. FigCanvas is designed to be user-friendly and does not require any coding skills. Any researcher can generate visualizations simply by uploading data or describing desired visuals in plain language.
Yes, users can edit the figures generated by FigCanvas. The tool allows users to convert every figure into an editable SVG for customized adjustments. Users can adjust labels, colours, text, and individual elements, all within their browser.
FigCanvas can generate a vast range of scientific visuals. This includes illustrations, flowcharts, and data visualizations. Specifically, it can support creation of biological visuals, diagrams of pathways and mechanisms, cell biology visuals, and experimental overviews.
For data visualization, FigCanvas allows users to upload their dataset or structured values to generate scientific visualizations rapidly, without the need to manually recreate each figure. FigCanvas has the capability to turn raw data into easy-to-read and shareable figures.
FigCanvas supports multiple export formats. Users can export created figures as SVG, PNG, or PDF. This variety allows for easy integration into diverse platforms or usage requirements, such as manuscripts, posters, or presentations.
Yes, FigCanvas is calibrated to meet the visual standards of leading science journals. It does this by studying thousands of figures from top-tier journals to understand what makes a figure publication-ready.
Indeed, FigCanvas is adept at converting text descriptions into visuals. After a user inputs a plain-language prompt or methodology text, FigCanvas uses AI to create an initial draft of the visual representation required, which can then be refined and used.
FigCanvas aids in the creation of methodology flowcharts through its text to flowchart capability. Users simply need to paste their methodology text or protocol, and FigCanvas will automatically extract the steps and generate a clean, editable flowchart.
Yes, FigCanvas does support bioinformatics pipeline visualization. It allows users to input their methodology, after which it generates a clear, editable flowchart representing the bioinformatics pipeline.
FigCanvas employs an 'infinite canvas' feature to facilitate the creation of multi-panel figures. This unique feature allows for simultaneous handling and alignment of various data visualizations, scientific illustrations, and flowcharts, making it easier to design multi-panel figures that meet journal expectations.
Yes, FigCanvas supports the visualization of cell biology. Alongside pathway diagrams and molecular mechanisms, it can create detailed and refined illustrations for cell biology visuals.
FigCanvas is indeed designed with the intention of creating visuals for top-tier journals. It has been calibrated to match the visual standards of these top-tier journals by studying thousands of figures to understand what looks professional and publication-ready.
FigCanvas does allow the transformation of raw data into visuals. It has a comprehensive platform that allows users to input raw data, which the tool then processes and translates into clear, understandable figures and diagrams.
In terms of scientific workflow representation, FigCanvas allows users to input methodologies as text. It then uses this information to create clean, understandable flowcharts that represent the workflow of the experiment, CONSORT diagrams, and bioinformatics pipelines.
Yes, FigCanvas does offer editing capabilities. Every figure generated can be converted into an editable SVG format. After generating a figure, users can refine labels, prompts, and layout, making any necessary adjustments before exporting.
FigCanvas allows every figure generated to be converted into an editable SVG directly on its platform. Users can adjust labels, colors, text, and individual elements in the browser without needing to download and open in a separate tool.
The draft generation process in FigCanvas is very quick. It uses AI to generate a working first draft in under two minutes, providing users with a fast, efficient way to create professional scientific figures.
Pricing
Pricing model
Free Trial
Paid options from
$9.90/unit
Billing frequency
Pay-as-you-go