

Overview
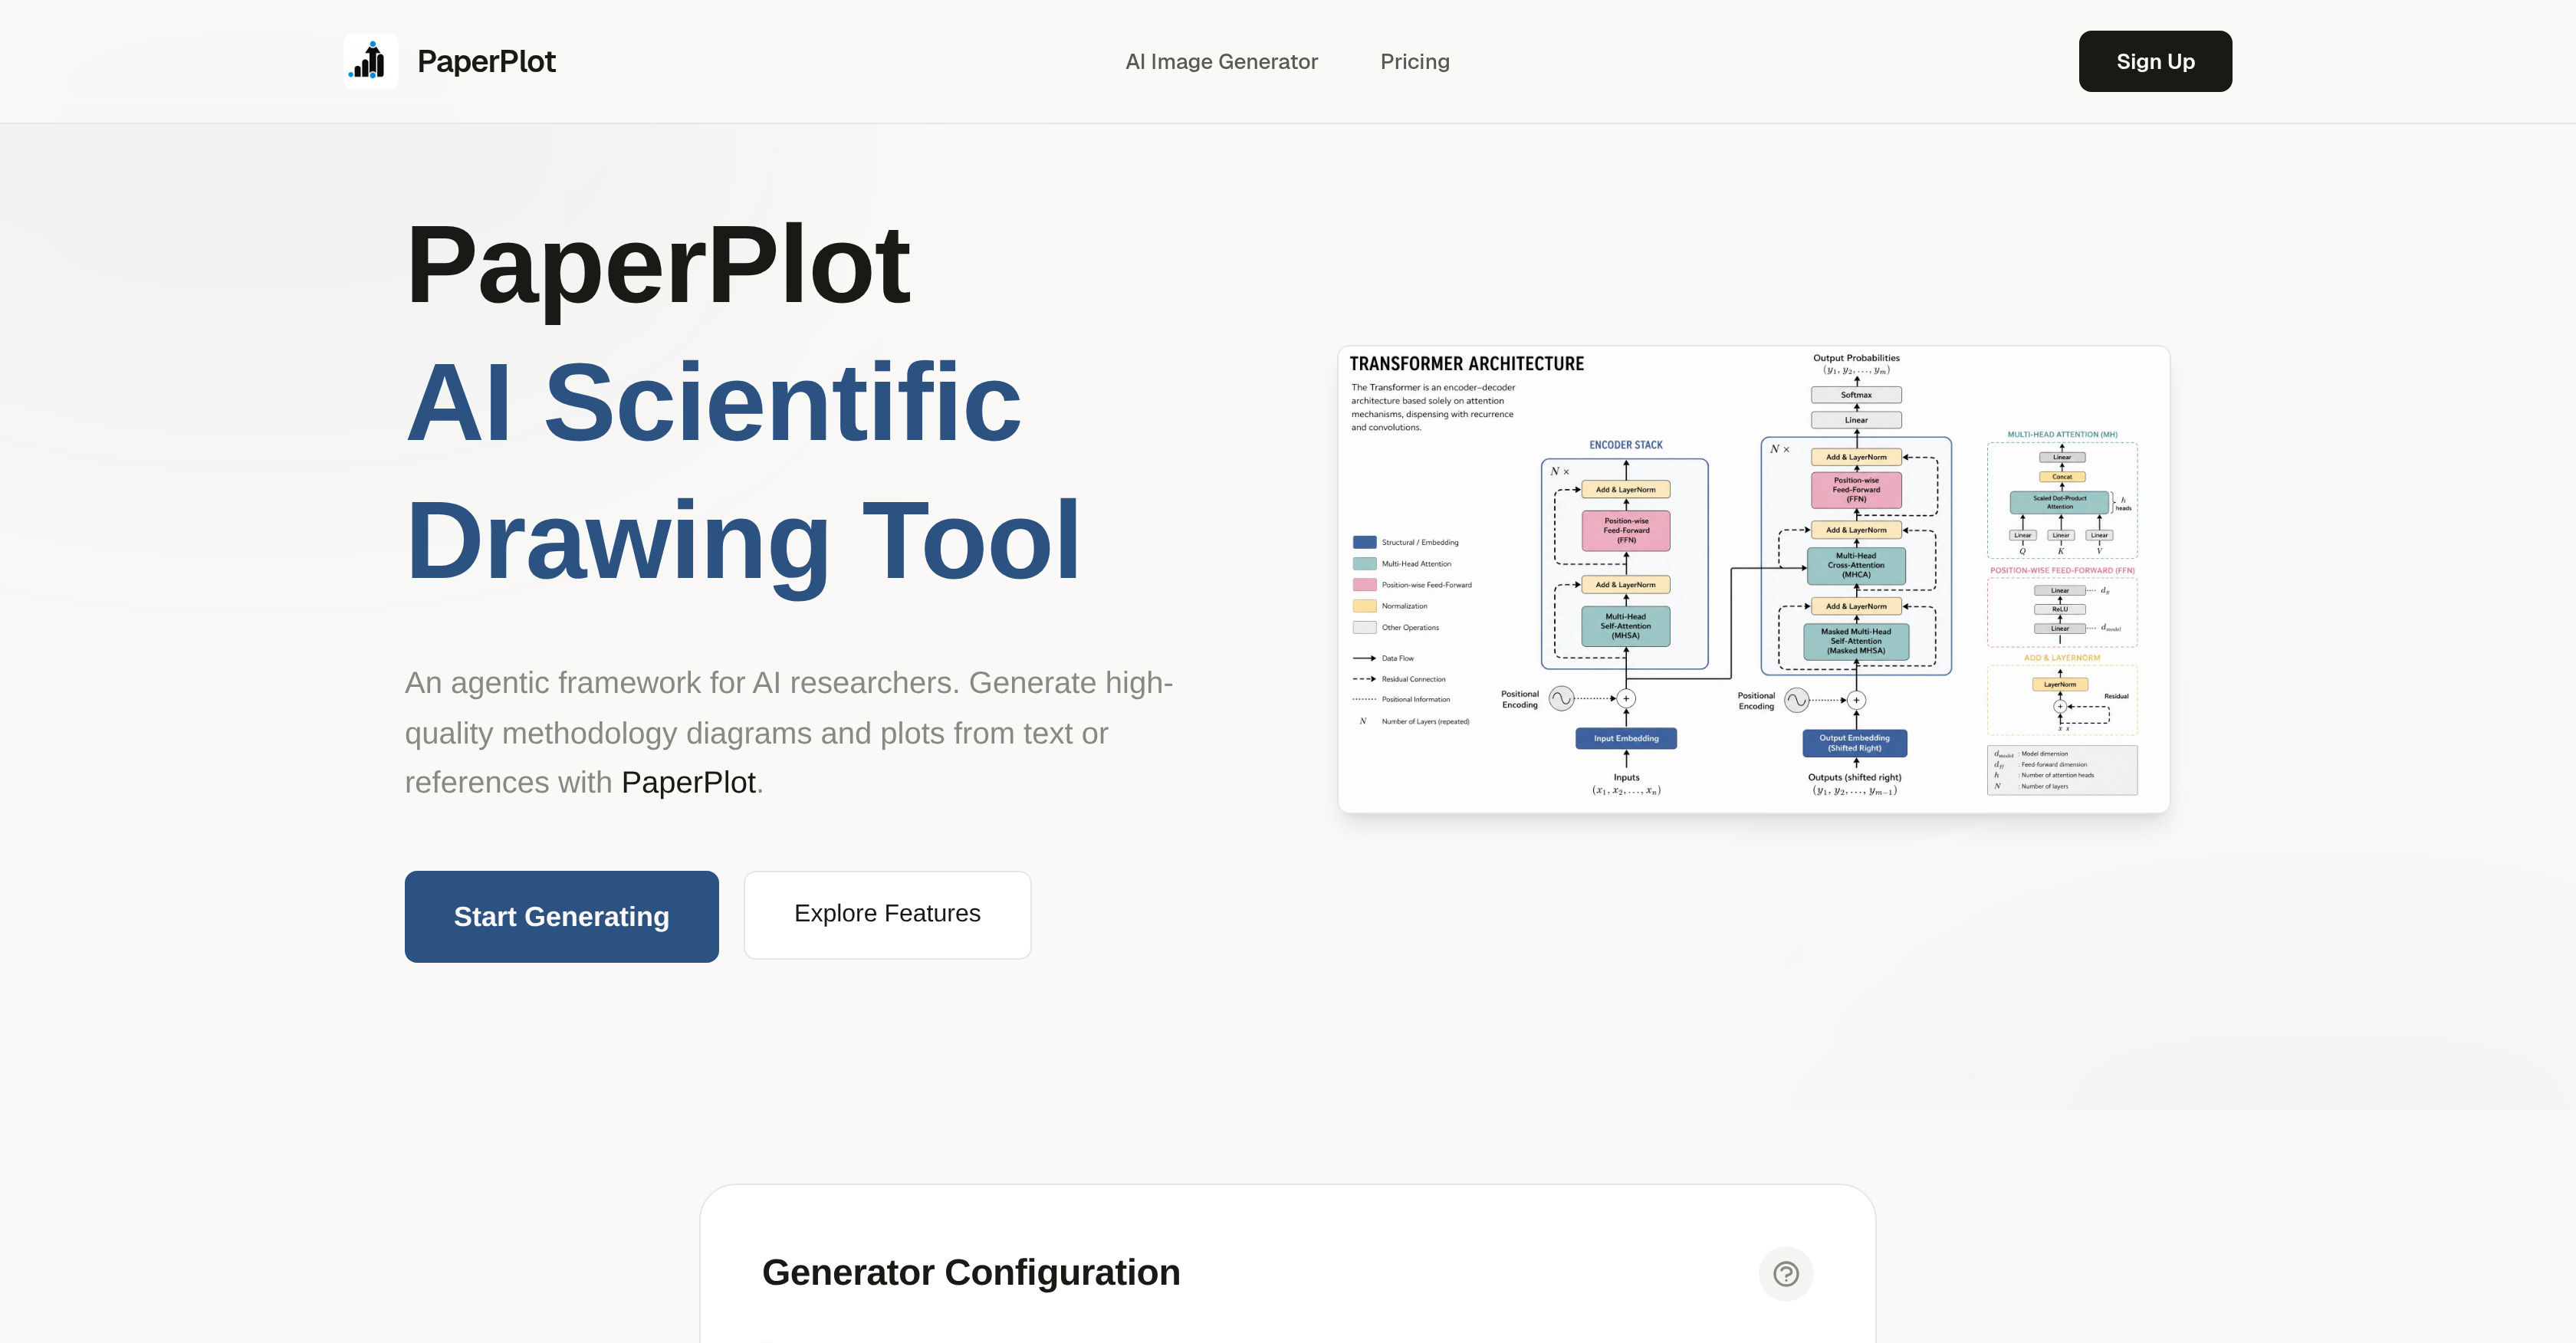
- Submit a research paper faster by generating publication-ready scientific illustrations from plain text descriptions, using PaperPlot's agentic workflow that retrieves context, plans layouts, and renders precise diagrams.
- Eliminate manual drafting with automated creation of complex methodology diagrams and model architecture figures that meet top-tier AI conference standards for faithfulness, conciseness, and aesthetics.
- Achieve academic precision in data presentation by producing high-quality statistical plots and data visualizations that adhere to rigorous publication standards, without needing design skills.
- Convert rough hand-drawn sketches into polished, vector-style digital diagrams while preserving your original layout and style consistency, thanks to the sketch-to-digital conversion feature.
- Save hours of revision time through an iterative self-critique refinement process that automatically evaluates and improves diagram accuracy and visual appeal before submission.
- Focus on core research instead of illustration tasks, as the automated framework handles all design principles from layout planning to final rendering for any academic paper requirement.
Pros & Cons
Pros
- Publication-ready diagrams
- Generates from text
- Agentic framework
- Statistical plots
- Sketch-to-digital conversion
- Layout preservation
- Automated design
- Research automation
- Text-to-image capabilities
- Multimodal capabilities
- Visual intent interpretation
- High-quality output
- Iterative refinement
- Context Retriever
- Layout Planner
- Image Renderer
- Output Critic
- Academic precision
- Benchmarked against standards
- Includes PaperPlotBench
- Polishes hand-drawn sketches
- Maintains style consistency
- Clear data presentation
- Professional platform
- Fine-tuned for scientific accuracy
- Self-critique refinement
- Faithfulness of design
- Adheres to conciseness
- Aesthetic design
- Methodology diagrams
- Top-tier conference standards
- Handles complex flowcharts
- Handles system overviews
- Accurate data representation
- Vector-quality output
- Model architecture diagrams
- Open source collaboration
- Suite of 292 benchmarks
- State-of-the-art VLMs
- Image generation models
- Automates illustration process
- Can outperform baselines
- Meets rigorous standards
- Automates manual drafting
- 2K, 4K, Auto resolution
- Aspect Ratio flexibility
- Encourages innovation
- Supports multiple languages
- Factored polishes hand-drawn sketches
Cons
- Niche-specific
- Complex agentic framework
- No UI personalization options
- Potential misinterpretations of text
- Limited to academic illustrations
- Dependent on user's visual intent
- No multi-language support
Reviews
Rate this tool
Loading reviews...
❓ Frequently Asked Questions
PaperPlot is an advanced AI scientific illustration platform designed primarily for researchers. It specializes in the creation of publication-ready academic illustrations, such as detailed methodology diagrams and precise statistical plots.
Key features of PaperPlot include the generation of academic illustrations from textual descriptions or rough sketches, as well as a layout planning, image rendering process, and meticulous refining of generated images. It offers a sketch-to-digital conversion feature for maintaining style consistency and layout preservation of hand-drawn diagrams. It also produces high-quality statistical plots and includes PaperPlotBench, a benchmark of curated test cases for automated scientific illustration.
Yes, PaperPlot is designed to generate diagrams from textual descriptions. It transforms abstract concepts into visual diagrams effortlessly using its agentic framework.
The agent framework of PaperPlot functions through multiple agents, including 'Retriever', 'Planner', 'Renderer', and 'Critic'. They work collectively to gather context, plan layouts, produce initial images and subsequently improve the output iteratively via a self-check process.
The agents employed by PaperPlot include the 'Retriever', which gathers context, the 'Planner' which lays out the design, the 'Renderer' which produces the initial image, and the 'Critic' who checks and refines the image iteratively for greater precision and aesthetics.
PaperPlot ensures the quality of the output generated via a meticulous refining process. This refining process ensures the output aligns with the principles of faithfulness, conciseness, and aesthetics. Also, the 'Critic' agent plays a pivotal role in auditing and refining outputs to enhance fidelity and aesthetics.
Yes, PaperPlot does offer a sketch-to-digital conversion functionality. This feature allows users to create professional diagrams based on initial hand-drawn sketches, preserving their initial style and layout.
Yes, in addition to generating diagrams, PaperPlot can also produce high-quality statistical plots. This element of PaperPlot focuses on presenting data clearly and with academic precision.
Yes, PaperPlot has been benchmarked vis-a-vis standards of top-tier AI conferences and has been fine-tuned for scientific accuracy.
PaperPlotBench is a comprehensive benchmark of curated test cases offered by PaperPlot. Its purpose is to foster innovation in the field of automated scientific illustration.
Yes, PaperPlot is a platform that is specifically designed to serve the needs of academic researchers. It generates publication-ready academic illustrations and diagrams which are apt for presenting in a research paper or publication.
Yes, PaperPlot does have data visualization capabilities. It effectively generates high-quality statistical plots to represent data with clarity and academic precision.
Yes, PaperPlot specializes in generating complex methodology diagrams. It can create figures from textual descriptions or rough references, making it a valuable tool for academia and researchers.
PaperPlot handles hand-drawn diagrams with a unique sketch-to-digital conversion feature. This feature lets users upload their rough hand-drawn sketches, and PaperPlot refines them into professional, polished illustrations while preserving the original style and layout.
PaperPlot's refining process follows the principles of faithfulness, conciseness, and aesthetics, ensuring that each output adheres to these parameters for maximum utility and visual appeal.
PaperPlot can generate a variety of academic illustrations, including detailed methodology diagrams and highly precise statistical plots. It can also refine hand-drawn sketches into digital diagrams.
In PaperPlot, the 'Critic' agent performs the role of assessing the image outputs and subsequently refining them. It strictly evaluates the generated images to ensure they adhere to the principles of faithfulness, conciseness, and aesthetics.
Yes, in its sketch-to-digital conversion process, PaperPlot upholds style consistency. It takes users' hand-drawn sketches and refines them into professional illustrations, while preserving the initial style and layout.
PaperPlot is particularly suited for academia and researchers due to its capability to create publication-ready academic illustrations and statistical plots from text or rough references. It is benchmarked against standards from top-tier AI conferences, ensuring the output meets the rigorous standards required for academic publication.
PaperPlot fosters innovation in automated scientific illustration through the provision of PaperPlotBench. This benchmark of curated test cases is provided to the community to foster innovation and encourage new methodologies in automated scientific illustration.
The agentic workflow in PaperPlot plays a crucial role in automating the creation and refinement of diagrams. It involves a step-by-step process: the 'Retrieve' stage gathers context, 'Plan' organizes the layout, 'Render' generates the initial image using advanced models, while 'Refine' enhances the output through a self-critique process. This workflow ensures high accuracy and aesthetics in the diagrams created.
PaperPlot allows the creation of varied types of diagrams. It excels at producing complex methodology diagrams, such as model architecture designs and flowcharts, and also precise statistical plots. Essentially, PaperPlot can cater to virtually any visual requirement for an academic paper.
Yes, with PaperPlot, you can refine your hand-drawn sketches. Beyond creating diagrams from scratch, PaperPlot provides a powerful polishing capability wherein rough hand-drawn sketches or draft diagrams can be input, and the system will refine them into professional, vector-style illustrations.
Absolutely, PaperPlot is suitable for top-tier conference presentations. The system is benchmarked against standards from elite AI conferences like NeurIPS. The evaluation metrics focus on attributes such as faithfulness, conciseness, readability, and aesthetics to make sure the output meets stringent publication standards.
You do not need to have design skills to use PaperPlot. The platform is designed to bridge the gap between research ideas and visual communication. You only need to provide the scientific context, and the agentic framework will handle the design principles, automating the process of creating high-quality academic illustrations.
The agentic framework of PaperPlot ensures the accuracy and aesthetics of the diagrams through its final 'Refine' step. This step incorporates a self-critique mechanism where the agents evaluate and refine the outputs strictly, adhering to the principles of faithfulness, conciseness, and aesthetics. Such an iterative refining process ensures that the output not only meets the rigorous standards of top-tier AI conferences, but also maintains a consistently high quality.
The sketch-to-digital conversion function in PaperPlot allows users to input their hand-drawn sketches and have them refined into professional, vector-style illustrations. The feature is designed to interpret the user's visual intent, maintain style consistency, and preserve the original layout, transforming the rough sketches into polished diagrams.
PaperPlot integrates textual descriptions into the diagram creation process through the first two steps of the agentic workflow: 'Retrieve' and 'Plan'. The system accepts textual descriptions and uses it to gather context ('Retrieve') and design the layout ('Plan'). This allows for the transformation of abstract ideas expressed in text into visual diagrams.
The multimodal capabilities of PaperPlot enable it to interpret not just text-based input but also visual input like rough sketches, bridging the gap between research ideas and visual communication. PaperPlot has the feature to control multiple modes of input – text or sketches – and has the capability to seamlessly handle both text-to-image generation and iterative refinement via self-critique.
The refining process in PaperPlot is a part of its agentic workflow. In the 'Refine' stage, a self-critique mechanism is used where the specialized agents compile a feedback loop to continually evaluate and improve the diagrams for maximum accuracy and improved aesthetics.
PaperPlot aids academic research by simplifying and automating tasks related to creation of visual representation of data and concepts. Instead of spending time on creating methodology diagrams or statistical plots manually, researchers can focus on their core research, as PaperPlot generates high-quality, academic precision diagrams from text or rough sketches.
The 'Retrieve' function in the agentic workflow of PaperPlot is the first step which involves the gathering of context needed for creating the diagrams. Relevant details are collected either from the textual description or rough reference provided by the user, setting the foundation for the subsequent stages in the workflow.
In the context of PaperPlot's functionality, 'rough references' can be hand-drawn sketches or draft diagrams provided by the users. These sketches serve as a visual guide for the AI, which interprets the user's intent and refines the rough sketches into stylized, professional diagrams.
In PaperPlot, layout preservation comes into play particularly during the sketch-to-digital conversion. Despite transforming a rough, hand-drawn sketch into a stylized, professional diagram, the layout originally conceived by the user is preserved, ensuring that the output maintains the desired structural arrangement.
Yes, PaperPlot offers capabilities for effective data visualization. Beyond generating methodology diagrams, it can also create high-quality, academically rigorous statistical plots. The aim is to present data with clarity and academic precision, thereby supporting effective data visualization.
PaperPlot can generate high-quality, precise statistical plots. These are focused on presenting data with utmost clarity and academic precision, ensuring it adheres to the requisite standards of publishing in academic and research arenas.
The components of the 'self-critique refinement' in PaperPlot include a feedback loop mechanism wherein the generated diagrams are strictly evaluated and refined by the specialized agents. The refinement process targets three key principles: faithfulness, to ensure the diagram accurately represents the provided details; conciseness, to prevent unnecessary information overload; and aesthetics, to make the diagrams visually appealing.
PaperPlotBench, associated with PaperPlot, is a comprehensive benchmark of 292 curated test cases, taken from NeurIPS 2025. This benchmark is provided to the community to foster innovation in the field of automated scientific illustration, promoting open-source collaboration and continual improvement.
PaperPlot aids in research automation by taking over the labor-intensive task of creating publication-ready illustrations. This allows researchers to focus more on their core research rather than on the manual designing of diagrams. The agentic framework automates the creation of high-quality, academically precise diagrams and statistical plots, thereby saving time and resources for the researcher.
Pricing
Pricing model
Paid
Paid options from
$9.90/month
Billing frequency
Monthly