Overview
- Create complete data dashboards in seconds without writing any code or SQL queries using the AI-driven automation
- Connect your PostgreSQL database or REST API directly to instantly visualize your data without manual setup
- Spot critical metrics and uncover hidden business insights through automatically generated charts and visualizations
- Track key application performance indicators effectively with seamless data visualization that requires zero technical skills
Pros & Cons
Pros
- Simplifies data visualization
- Automatically creates dashboards
- Database connection capability
- Instant chart generation
- No coding required
- Eliminates SQL queries
- Compatible with PostgreSQL
- REST API integration
- Process and translates data
- Efficient data insights derivation
- Seamlessly identifies metrics
- Transforms data into charts
- More data sources in future
- Providing crucial business insights
- Fast dashboard construction
- Compatible with multiple sources
- Effortless data transformation
- Helps track metrics
- Database integration in seconds
- Elimination of manual code
- Variety of charts and visualizations
- Multi-data source compatibility
Cons
- Limited data source compatibility
- No manual design option
- No SQL query support
- Only produces charts
- No custom visualization options
- Potential over-simplification of data
- No control over speed of creation
- Restricted to PostgreSQL and REST APIs
- Future update dependency
Reviews
Rate this tool
Loading reviews...
❓ Frequently Asked Questions
Supadash is an AI-driven tool for data visualization that automatically constructs data dashboards. It enables users to readily connect their databases and efficiently generates charts to visualize data.
Supadash significantly simplifies data visualization by automatically creating data dashboards. With its AI-driven system, it eliminates the need for manual coding and writing SQL queries to design dashboards. It instantly generates charts for visualizing user data, reducing the complexity and time taken for data visualization tasks.
Yes, Supadash allows users to connect their own databases. It instantly generates charts after the database connection, assisting users in visualizing their data effectively.
Supadash can generate charts from connected databases in a matter of seconds. The AI-driven system automatically constructs the dashboard and produces charts for data visualization almost instantly.
No, manual coding or SQL knowledge is not required to use Supadash. Its AI-driven system handles the design and construction of dashboards, eliminating the need to write code or SQL queries.
Supadash supports different sources to feed data, including PostgreSQL databases and REST APIs. There are plans for more data source compatibility options in future updates.
Yes, Supadash is planning to offer more data source compatibility options in its future updates, information on specifics is currently not available.
Yes, Supadash is capable of processing and translating the data from a connected source into insightful charts and visualizations.
Yes, Supadash allows users to spot important metrics through the visualization of data on the constructed dashboards. It helps in tracking key metrics about user applications effectively.
Yes, Supadash not only enables users to spot key metrics but also helps derive crucial business insights from the data, through its seamless and efficient visual representations.
As of now, PostgreSQL databases are explicitly mentioned as compatible with Supadash.
Yes, Supadash allows integration with REST APIs for feeding data into the system.
Yes, an option to 'Try for free' is available on the Supadash website indicating a free trial availability.
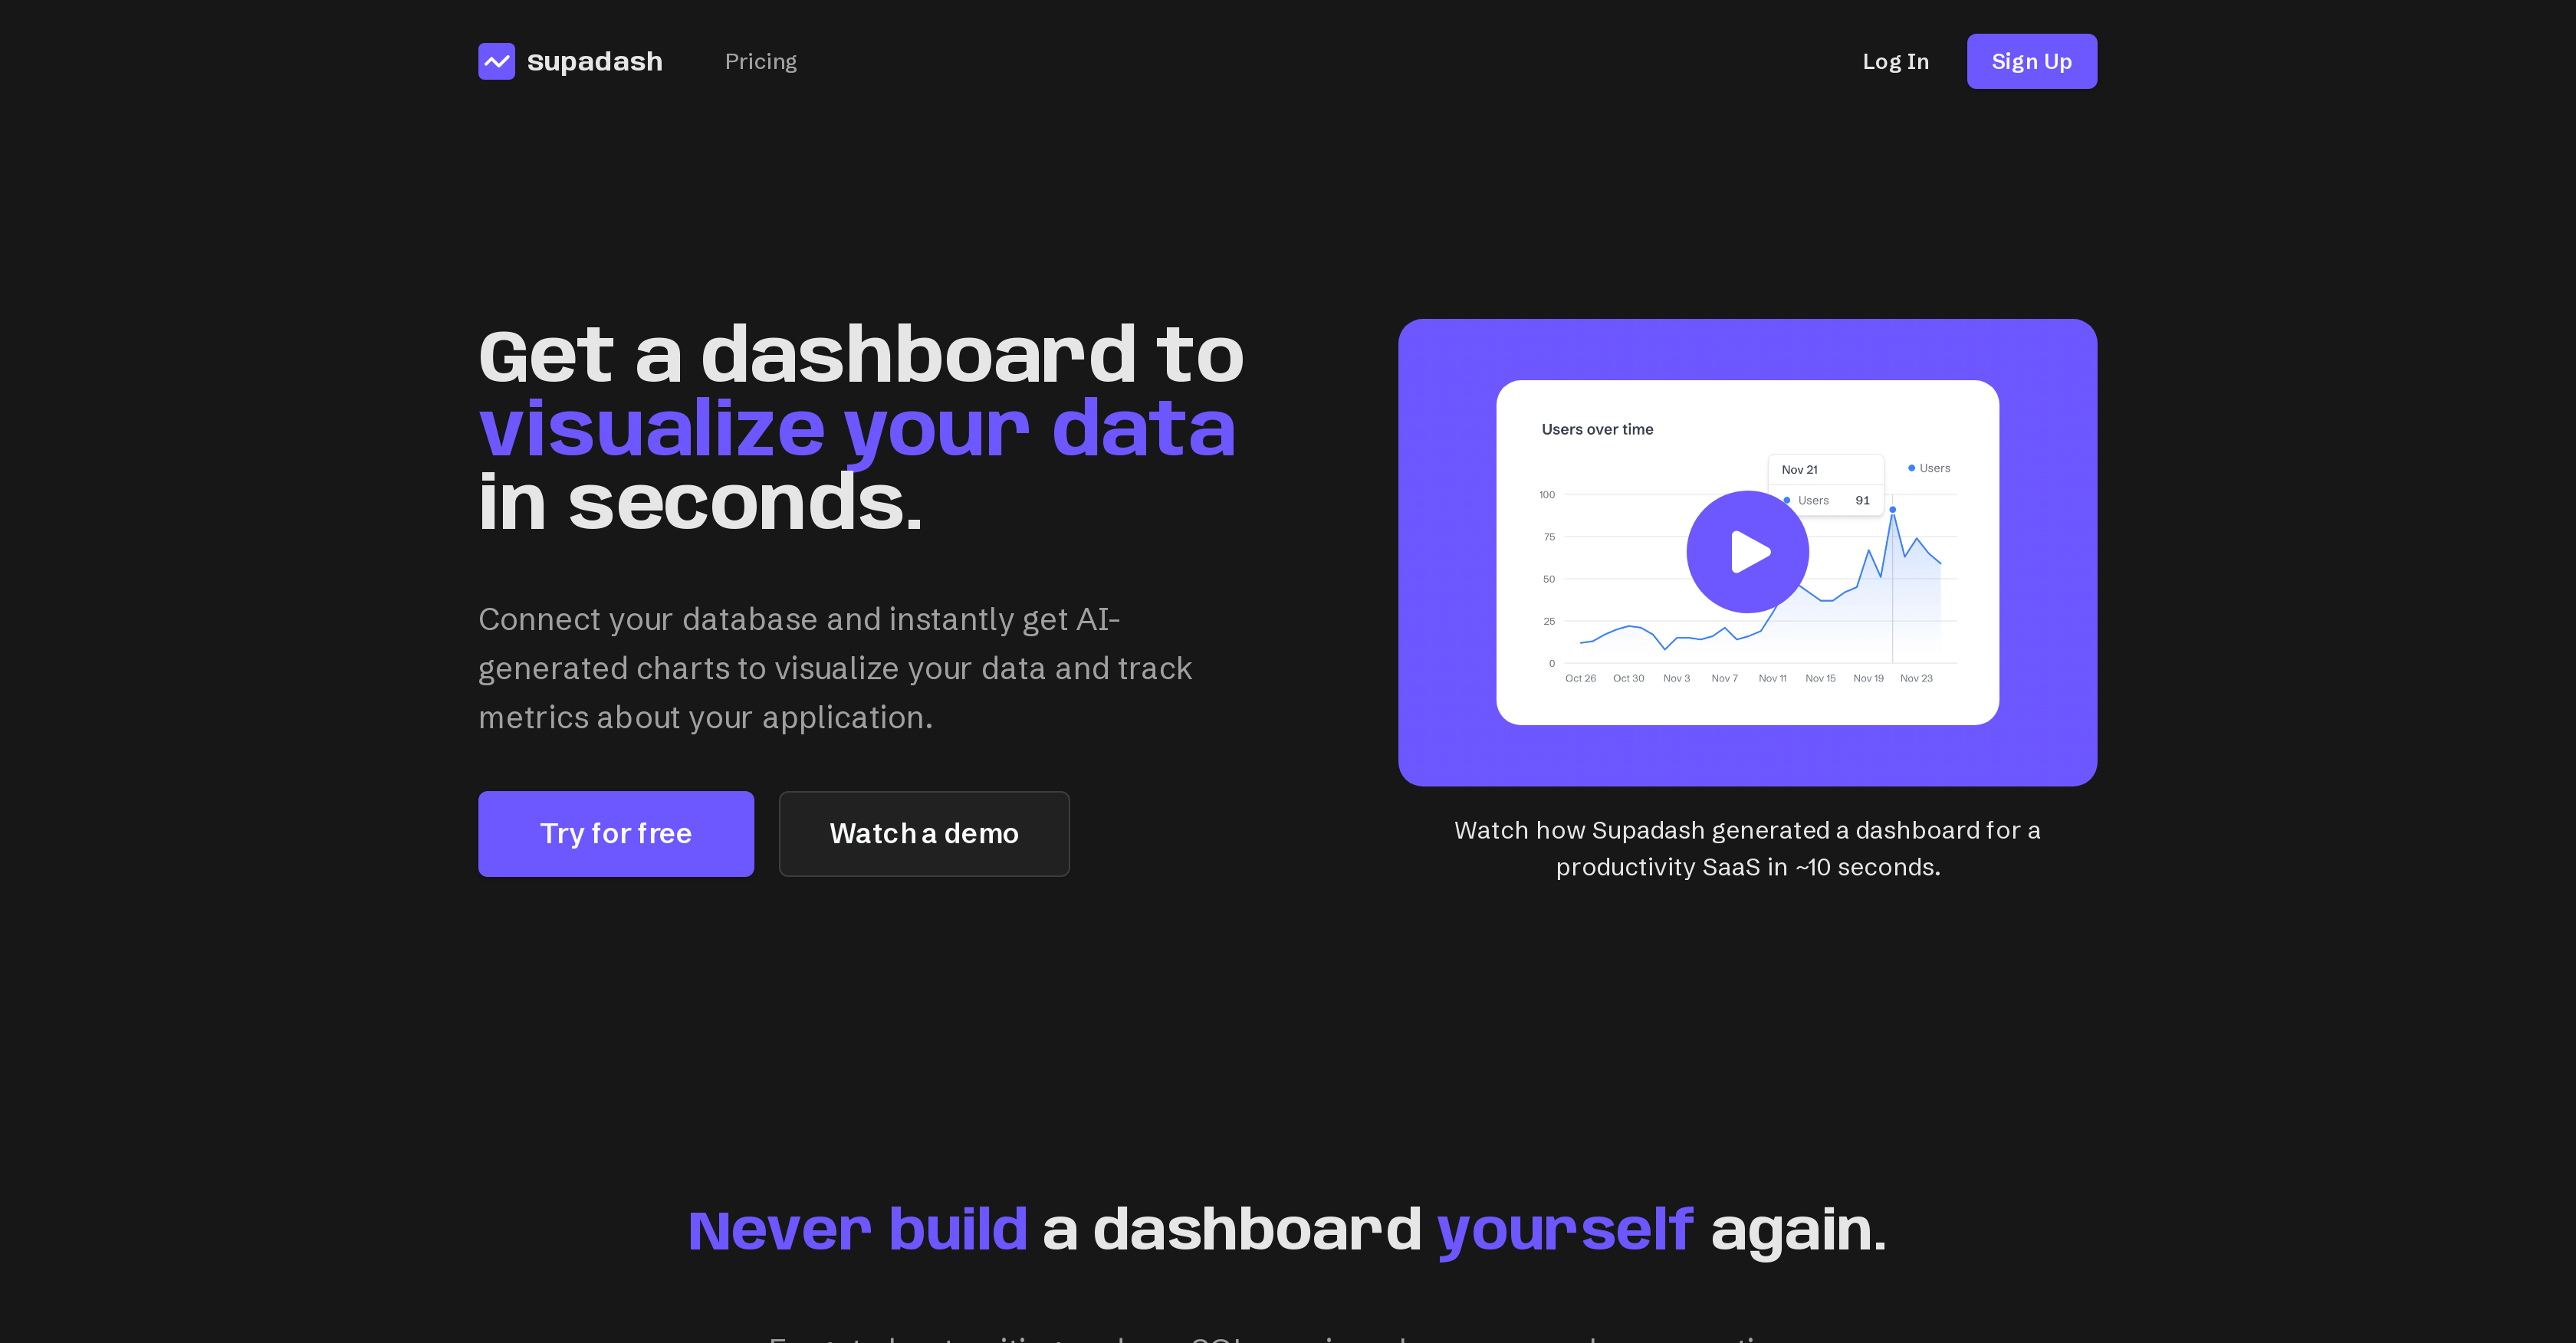
Yes, a demo of Supadash in action is available on their website. The demo provides a visual guide to how the platform generates a dashboard and its functionality.
Supadash automates the creation of dashboards with an AI-driven system. It eliminates the need for manual code or SQL queries in designing dashboards. Upon connecting a data source, such as a PostgreSQL database or a REST API, the tool automatically processes the data and builds a dashboard in mere seconds.
Exact types of charts and visualizations supported by Supadash aren't specifically mentioned, but the AI system can translate data into 'insightful charts and visualizations'.
Yes, there is an option to 'Sign Up' presented on the Supadash website indicating users can register for the service.
As of the available information, no specific pricing detail is provided on the Supadash website.
Yes, there is a 'Log In' option available on the Supadash website for users to access their account.
The AI-driven system of Supadash is described as highly efficient. It can automatically generate data dashboards in seconds with no need for manual coding or SQL knowledge, offering users a seamless and efficient experience in data visualization.
Pricing
Pricing model
Free Trial
Paid options from
$7/month
Billing frequency
Monthly