
SciDraw AI
Overview
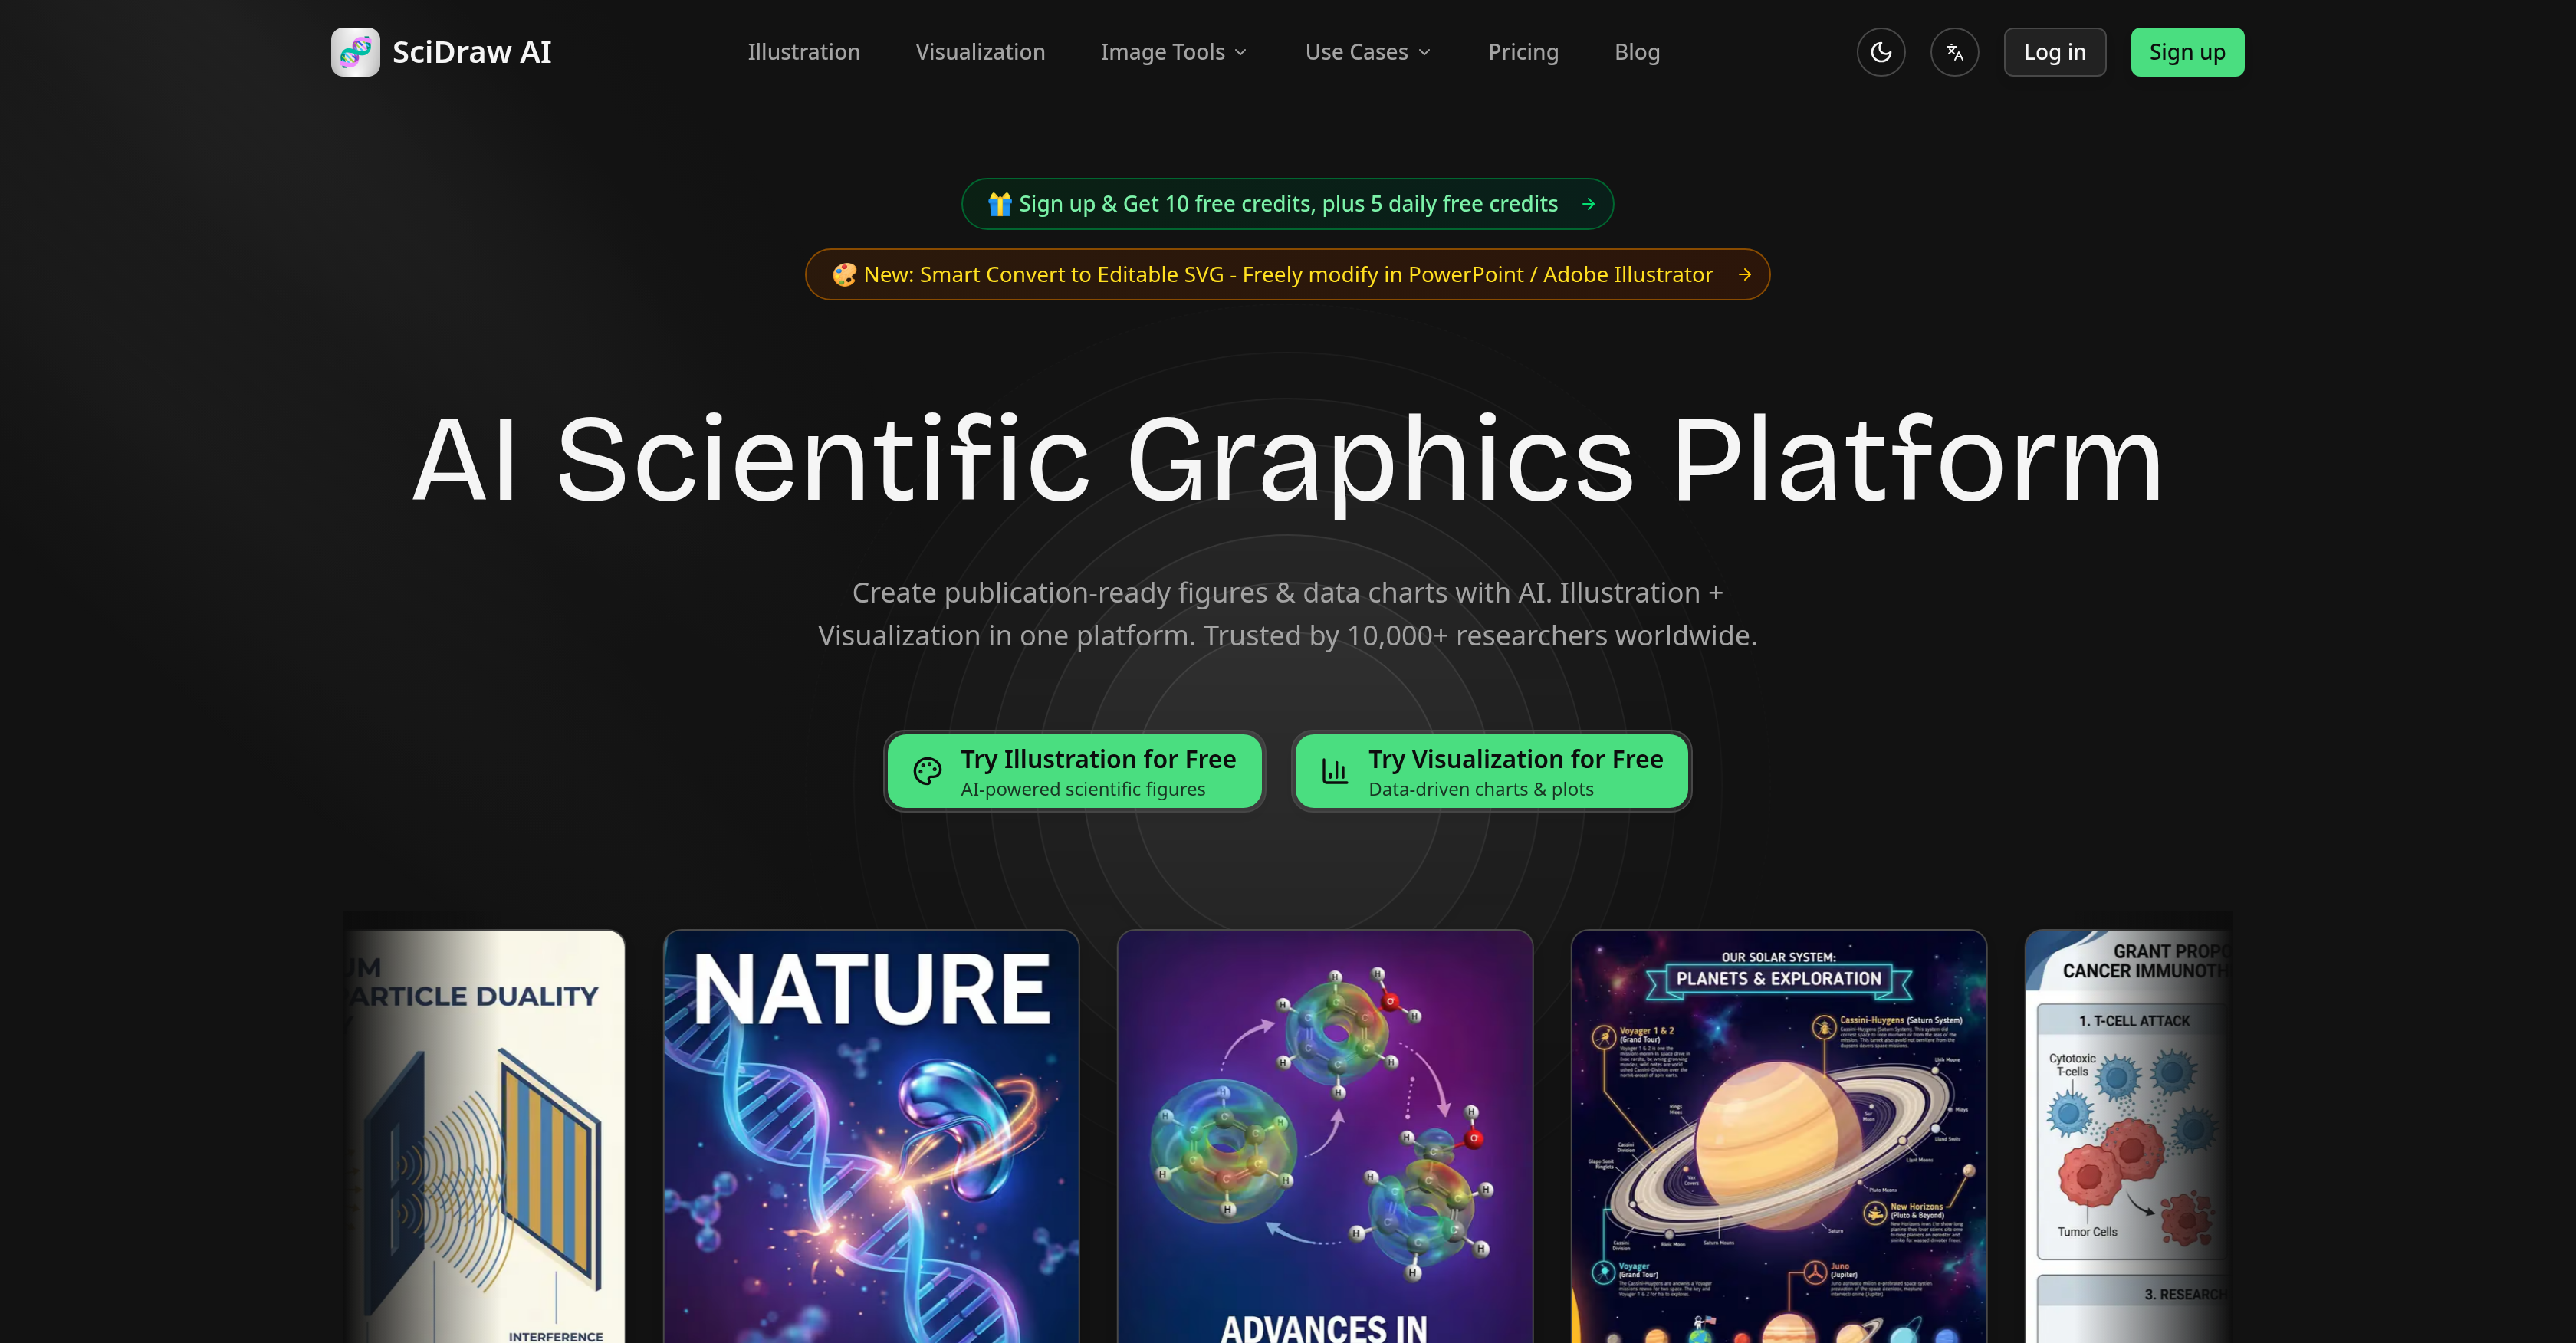
- Publish in top-tier journals like Nature, Science, Cell, PLOS, and ACS with figures that meet their exact standards, using templates and export options tailored to each publication’s requirements.
- Turn rough hand-drawn sketches into polished, professional figures ready for submission, eliminating hours of manual refinement.
- Generate publication-ready data charts—box plots, violin plots, scatter plots, heatmaps, regression charts—directly from CSV or Excel files, bypassing complex coding.
- Describe any scientific concept in text and receive a corresponding graphical visualization, removing the need for artistic skills or design software.
- Export final illustrations as editable SVG or PDF vector graphics, ensuring seamless integration into manuscript drafts and compatibility with journal submission systems.
- Automatically generate Python code compatible with matplotlib and seaborn libraries, enabling full customization and reproducibility of data-driven charts.
- Access a library of pre-built templates for journal covers, mechanism diagrams, graphical abstracts, and pathway diagrams to accelerate figure creation.
- Start with 10 free credits on registration and earn 5 daily credits to explore features, with Standard ($10/mo), Premium ($20/mo), and Enterprise ($40/mo) plans for expanded usage.
Pros & Cons
Pros
- User-friendly web interface
- Text-to-image conversion
- Sketch refinement technology
- Creation of data charts
- Accepts CSV and Excel files
- Exportable in SVG, PDF
- Adjustable to journal standards
- Various graphic templates
- Publication-grade charts generation
- Generates Python code
- Offers free trial
- Science communications support
- Education support
- Supports matplotlib, seaborn libraries
- Creates box plots, violin plots, scatter plots, heatmaps, regression charts
- Automates graphic generation
- Transforms hand-drawn designs
- Simplifies generation of scientific illustrations
- Enables creation of data visualizations
- Streamlines creation of publication-quality visuals
- Optimized for researchers and graduate students
- Supports creating mechanism diagrams
- Allows editing text for image description
- Performs multiple round refinements
- Supports popular science journals
- Generates visualizations from data files
- Includes seven professional templates
- Allows sharing of downloadable content
- Offers customer support
- Ensures scalable vector graphics
- Supports daily free credits system
- Provides style presets for journals
- Generates charts from data
- Requires zero design experience
- Saves up to 90% drawing time
- Reduces cost by 95%
- Offers credit-based pricing
- Supports multi-format export
- Promises improved paper acceptance rate
- Credit-based system for flexible pay-as-you-go
- Integrates data visualization and drawing
Cons
- No public API
- No OAuth authorization
- No SDK
- No CLI
- Lacks developer integrations
- Missing REST API
- Missing OpenAPI specification
- No webhooks
- No MCP server
- Limited export formats
Reviews
Rate this tool
Loading reviews...
❓ Frequently Asked Questions
SciDraw AI is an AI-powered platform that simplifies the generation of publication-quality scientific illustrations and data visualizations. It helps in converting textual descriptions of scientific concepts into graphical visualizations, refining hand-drawn sketches into polished figures, and creating publication-ready data charts from CSV and Excel files. The platform also generates python code for charts compatible with matplotlib and seaborn libraries. It doesn't provide a public API, SDK, or CLI but offers a user-friendly web interface.
SciDraw AI allows users to export their illustrations in both SVG and PDF formats.
Yes, SciDraw AI creates graphics adjustable to the standards of various well-known publications like Nature, Science, Cell, PLOS, and ACS.
SciDraw AI's text-to-image conversion feature takes a user-provided text description of a scientific concept and generates a corresponding graphical visualization.
SciDraw AI leverages sketch refinement technology to transform hand-drawn designs into polished, professional-quality figures.
SciDraw AI handles CSV and Excel files by using them to generate ready-to-publish data charts. It converts the data in these files into publication-grade charts that can be used in research and publications.
Yes, SciDraw AI offers the capability to create various types of diagrams, including mechanism diagrams and scientific figures.
Yes, SciDraw AI offers a variety of templates that help users to expedite the process of creating figures and mechanism diagrams.
Currently, SciDraw AI does not offer a public API, SDK, or CLI. Users are guided to use the web User Interface for their needs.
SciDraw AI's data visualization feature set includes the creation of various types of publication-grade charts from CSV or Excel data files such as box plots, violin plots, scatter plots, heatmaps, regression charts, etc.
Yes, SciDraw AI automatically generates Python code compatible with matplotlib and seaborn libraries, enabling researchers to create different types of plots with eased programming burden.
SciDraw AI aids science communicators by enabling them to create compelling scientific illustrations and data visualizations easily and quickly. It helps in converting complex scientific concepts into understandable visual narratives.
SciDraw AI can be used in academic research to create publication-ready scientific illustrations and data visualizations. It enables creation of charts from CSV or Excel data, transformation of hand-drawn sketches into professional figures, and allows text-to-image conversion of scientific concepts.
Yes, SciDraw AI features the generation of various types of plots including box plots, violin plots, scatter plots, heatmaps, and regression charts from CSV or Excel data files.
SciDraw AI can be used in a plethora of educational applications. It aids in the clear and engaging presentation of scientific concepts through high-quality illustrations and data visualizations. Therefore, educators can use SciDraw AI to enhance their teaching materials and improve student understanding.
SciDraw AI provides a user-friendly web interface. It is designed to cater to its primary user demographic of researchers, graduate students, educators, and science communicators, helping them to create or refine graphics with ease.
Yes, with SciDraw AI, users can upload their hand-drawn science designs and the AI refines the sketches and transforms them into polished figures suitable for publication.
SciDraw AI simplifies the generation of scientific illustrations by enabling the conversion of text descriptions into graphical visualizations, refining user's sketches, and facilitating the creation of publication-ready data charts from CSV/Excel files. It also provides different templates for creating figures and mechanism diagrams.
SciDraw AI is extremely valuable for graduate students in science. They can use it to quickly generate professional-level illustrations and data visualizations for their research papers and presentations. SciDraw AI helps in streamlining the process of creating figures, reducing the need for advanced design skills.
SciDraw AI operates on a credit-based system. Free users get a certain amount of credits on registration, and additional credits daily. There are also Standard, Premium and Enterprise plans available at different prices offering wider benefits, larger number of credits, priority technical support and faster image generation.
Yes, SciDraw AI has a unique text-to-image conversion capability. This allows users to generate scientific illustrations directly from text descriptions.
SciDraw AI utilizes advanced AI-powered sketch refinement technology. This unique feature allows users to upload hand-drawn designs, which are then transformed by the system into professional, polished figures.
SciDraw AI supports export in SVG and PDF formats. This ensures the created graphics are adjustable and compatible with a variety of applications, including professional journals.
Yes, SciDraw AI allows for the creation of ready-to-publish data charts from CSV and Excel files. The AI in SciDraw AI processes the data from the input files and generates visually appealing charts.
The graphics generated by SciDraw AI are adjustable to standards set by well-regarded scientific publications. These include but are not limited to Nature, Science, Cell, PLOS, and ACS.
SciDraw AI provides various templates to aid in the creation of figures and mechanism diagrams. These are specifically crafted to fulfill different scientific illustration requirements.
Despite its extensive set of features, SciDraw AI does not currently offer a public REST API, OpenAPI specification, MCP server, webhooks, SDK, CLI, or public OAuth authorization endpoint.
SciDraw AI automatically generates Python code that is compatible with matplotlib and seaborn libraries during the data visualization process. This integration simplifies the creation of advanced visualizations such as box plots, violin plots, scatter plots, heatmaps, regression charts, among others.
SciDraw AI's one-of-a-kind text-to-image feature uses AI to enable users to generate scientific illustrations from text-based descriptions. The AI assimilates the textual information and designs a corresponding visual representation.
SciDraw AI offers a wide array of templates which can be used to create different types of graphics. These include and are not limited to journal covers, mechanism diagrams, graphical abstracts, pathway diagrams, and various other forms of scientific illustrations.
SciDraw AI uses a credit system to manage usage of its platform. Depending on the pricing tier chosen by the user, they are provided with a certain number of credits per month. Each action, such as image generation or conversion, requires a certain number of credits.
Yes, SciDraw AI supports data-driven chart creation. Users can provide data in the form of CSV or Excel files to the system, which then uses AI algorithms to generate visually captivating and publication-ready charts.
Sketch refinement technology in SciDraw AI allows users to transform hand-drawn sketches into professional figures. This technology refines, enhances, and polishes uploaded sketches, maximizing clarity and presentation quality.
If users need support or assistance while using SciDraw AI, they can reach out to the SciDraw AI team via email at [email protected].
SciDraw AI offers various pricing plans catering to different levels of access. These include the Free plan, Standard plan for $10/month, the Popular Premium plan for $20/month, and the Enterprise plan for $40/month. Each plan offers different features and levels of access to SciDraw's AI services.
Yes, SciDraw AI does offer a free trial. Upon registration, users are provided with 10 credits which they can use to explore the platform's features. Beyond this, free users receive 5 credits daily, allowing continued trial of the services.
The images produced by SciDraw AI are of publication quality, suitable for use in renowned scientific journals. The AI ensures that all outputs are professionally rendered, incorporating necessary features and styles.
All SciDraw AI plans, including the free plan, permit the use of generated images for journal publication and commercial use. This means that users have full rights to utilize the results in both academic and commercial contexts.
Pricing
Pricing model
Freemium
Paid options from
$10/month
Billing frequency
Monthly
Related Videos
SciDraw — AI-Powered Scientific Illustration in Seconds
SciDrawAI•70 views•Mar 30, 2026