

Overview
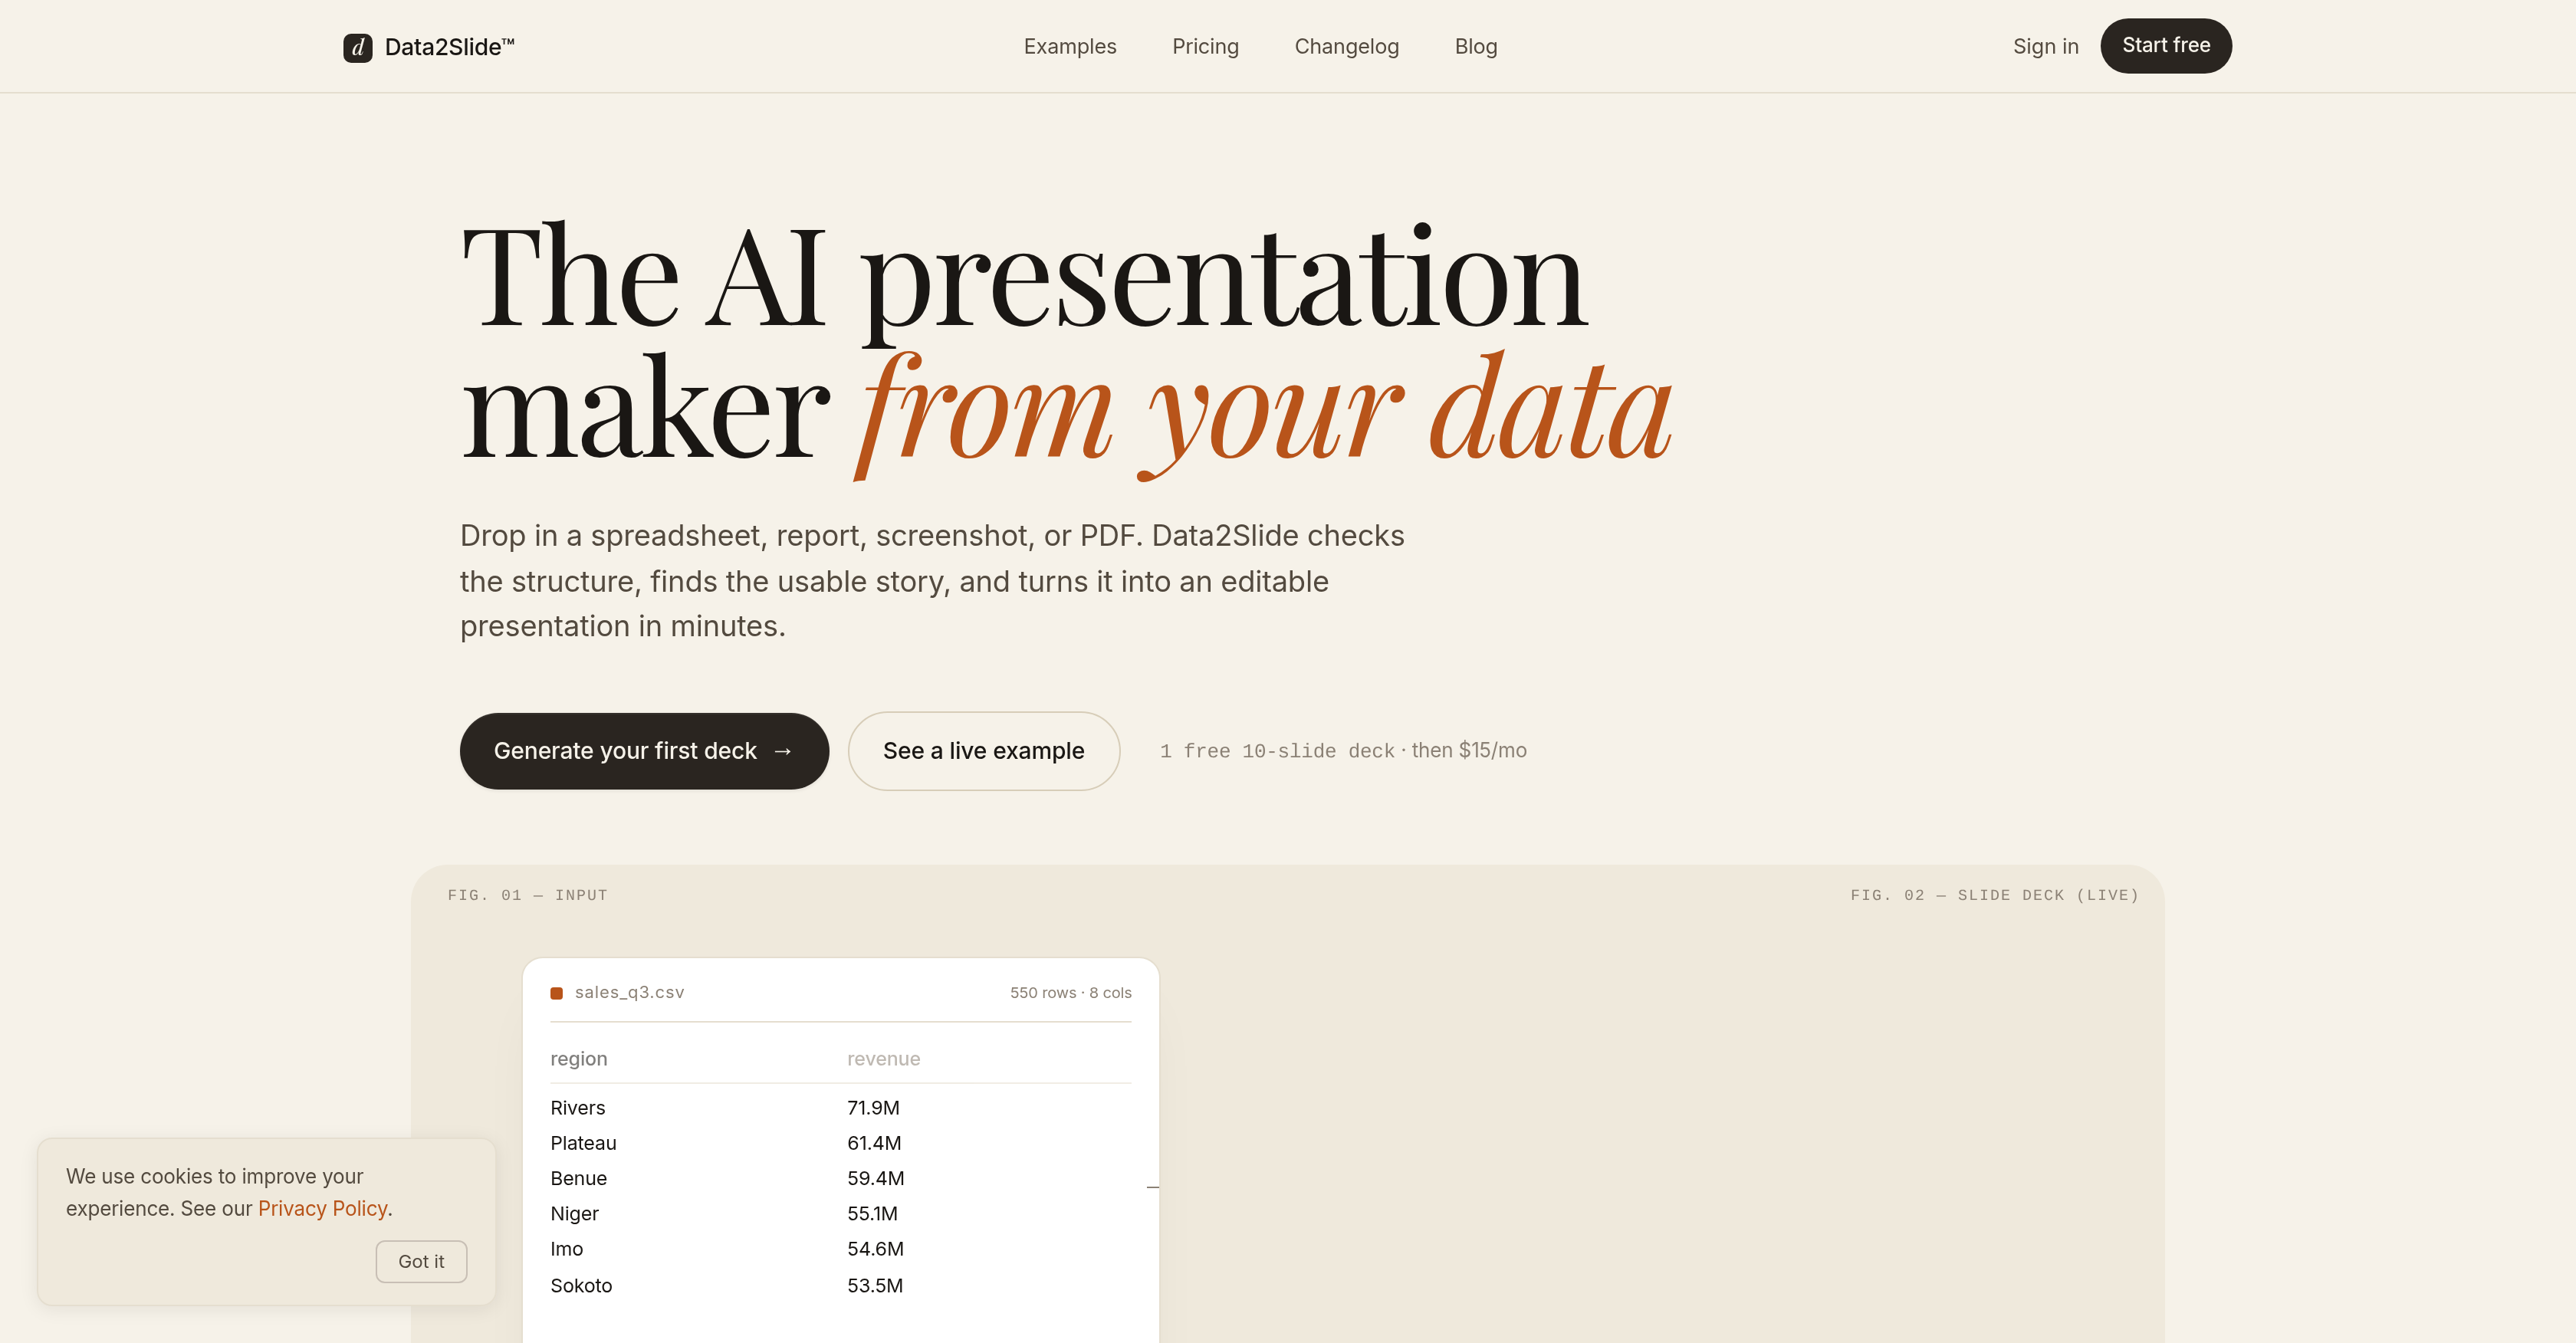
- Turn raw CSV, Excel, PDF, or screenshot files into interactive, data-driven HTML presentations in under 5 minutes, eliminating manual slide building.
- Deliver live presentations directly from the platform or share via a link, enabling instant engagement with stakeholders during meetings or webinars.
- Download completed presentations for offline use, ensuring access to data insights without an internet connection.
- Automate the extraction of key trends and patterns from complex datasets, producing visually compelling infographics and charts without manual analysis.
- Upload data in its original format—no preprocessing or conversion needed—saving hours of file preparation before creating slides.
- Start for free with a 10-page presentation, then unlock larger file processing and advanced export options with a paid plan for growing data needs.
Pros & Cons
Pros
- Interactive HTML presentations
- Data extraction insights
- Structured storytelling
- Web-native presentations
- Live presentation capability
- Link sharing option
- Offline download
- Tailored for data-driven storytelling
- Generates under 5 minutes
- Supports various file formats
- Automates presentation creation
- Supports CSV, Excel, PDF
- Interactive presentations
- Designed for live presentations
- Rapid data to slide conversion
- Dynamic conversion approach
- Aids business professionals
- Automates slide creation
- Evolving tool
- Time-saving solution
- Data visualization capacity
- Compatible with different formats
- Support for larger files
- Advanced exports
- Shared or individual use
- Variant functionalities
- Versatile presentation options
- Business-oriented tool
- Data interpretation feature
- Offline use possible
- Time efficient tool
- Automated data interpretation
- Engaging visual slides
- Fast document conversion
- Comprehensible visual slides
- Designed for professional use
- Supports screenshots as input
- Innovative data presentation
- Can process complex data
- Support for multiple pages
Cons
- Limited free version
- Potentially inconsistent processing times
- Doesn't support all file formats
- Lacks static PowerPoint-style option
- Unclear advanced export functionalities
- Potential compatibility issues
- Dependent on quality of data input
- No direct customer support mentioned
- Tool still evolving
- Unclear update schedule
Reviews
Rate this tool
Loading reviews...
❓ Frequently Asked Questions
Data2Slide is an AI-assisted tool designed to help users create comprehensive, interactive presentations from their data. The platform allows data files to be uploaded in several formats, which it then converts into ready-to-share presentations in a compressed time frame.
Data2Slide uses AI to convert uploaded data files into complete, interactive presentations. It takes the user's data, whether that be CSV, Excel, PDF, or even screenshot format, and turns them into professionally-styled presentations. The resultant presentations are ready in a short time frame for live presentation or sharing with others.
Users can upload data files in various formats, including CSV, Excel, PDF, and even screenshots.
Data2Slide uses its built-in Artificial Intelligence capabilities to analyze user-uploaded data and intelligently transform it into an interactive, visually appealing presentation.
The time it takes for Data2Slide to prepare a presentation is considerably short. However, the exact length of time can vary due to factors such as data complexity and file size.
Yes, Data2Slide is designed to prepare presentations that are ready for live presentations.
Yes, presentations created using Data2Slide can be downloaded for offline use.
Data2Slide has a user-friendly interface designed to streamline the process of transforming raw data into presentations.
AI is the backbone of Data2Slide. It’s used to analyze provided data and intelligently transform it into detailed, interactive presentations.
Yes, Data2Slide is a data visualization tool as it transforms raw data into visually appealing presentations.
Yes, Data2Slide allows users to share the presentations they create with others.
The final rendering time in Data2Slide can be influenced by factors like the complexity of the data and the size of the file uploaded.
Yes, you can upload a screenshot on Data2Slide, along with other data file formats like CSV, Excel, and PDF.
Yes, Data2Slide accepts and supports PDF file uploads.
The unique feature of Data2Slide is its ability to deliver prepared presentations in a compressed time frame, ready for live presentations or sharing with others.
Data2Slide uses its AI capabilities to handle data complexity, allowing it to transform even complex data types into comprehensive presentations.
Yes, Data2Slide allows you to convert your CSV files into a visually appealing and interactive presentation.
Data2Slide leverages advanced AI algorithms to process the data users upload, lookout for patterns, important points, and key insights. Then, it structures these insights in a logical and visually engaging manner within the presentation. The mechanisms of insight extraction rely on AI's data analysis and interpretation skills.
Data2Slide supports various file formats including CSV, Excel, PDF, and you can even upload screenshots. This variety ensures that you can use your data in its existing format without needing to convert it.
Data2Slide does offer free usage, which allows for the creation of one interactive presentation of up to 10 pages. However, to unlock additional functionality, larger file processing, and advanced exporting options, you would need to subscribe to one of the paid plans.
Unlike traditional AI slide makers, which mostly focus on creating static PowerPoint-style decks, Data2Slide specializes in creating interactive, data-centric presentations. It's designed more for dynamic and engaging storytelling with data.
'Interactive, data-driven storytelling' in the context of Data2Slide means the creation of presentations that engage the user and viewer through data visualization and arrangement. This includes infographics, charts, and diagrams to make the data more understandable and visually pleasing.
You can share your Data2Slide presentations by providing a link, which can be accessed by anyone with whom you share it. Alternatively, you can also present it live through various meeting platforms or integration methods.
Yes, indeed. One of the options available with Data2Slide is downloading the presentations for offline use. That way, you can access and showcase your data insights wherever and whenever, even without an internet connection.
With Data2Slide, you can create interactive, data-driven html presentations. The content of these presentations is based on the data you provide, transformed into a structured, visually pleasing format by AI.
Yes, Data2Slide is designed to be suitable for business professionals. It allows them to present complex data in an easily understandable format, saving significant time and effort involved in manual creation of such presentations.
Once you have uploaded your data, Data2Slide can create a presentation in under five minutes. This timing assumes standard conditions and might vary depending on factors such as data complexity.
Yes, Data2Slide offers support for both PDF and Excel data. You can directly upload these file formats, and the AI will process the data within to generate an interactive presentation.
The advanced export options on Data2Slide are available with the paid plans. While the specific details are not mentioned on their website, typically this could mean capabilities like exporting in various formats, resolution options, or inclusion of specific metadata.
Data2Slide structures the story based on your data by utilizing AI to identify key data points and trends, which it then presents in a coherent and logical manner. This turn-key approach turns raw data into a structured story.
There may be limitations on the size of the files you can upload to Data2Slide, but the specifics have not been indicated on their website. Normally, such restrictions might become more accommodating with paid plans.
Data2Slide continues to evolve and improve through ongoing development and upgradation of its AI algorithms and features. The company is committed to keeping the tool ahead of the curve and in tune with the ever-changing technological landscape.
Absolutely, you can present your Data2Slide presentations live. This is one of the functionalities it offers, allowing users to directly use the interactive presentations for live meetings or webinars.
To get started with Data2Slide, navigate to their website, sign up, and create an account. From there, you can upload the file you want to transform into a presentation. Once you've uploaded the data, the AI goes to work creating your presentation.
The specific amount of time you can save by using Data2Slide to generate presentations will largely depend on the complexity of your data and your familiarity with presentation tools. However, given that Data2Slide promises a producing time under 5 minutes, significant time savings can be expected, considering the traditional manual methods.
Pricing
Pricing model
Free Trial
Paid options from
$15/month
Billing frequency
Monthly
Refund policy
View Policy