
Canva's Magic Insights
Overview
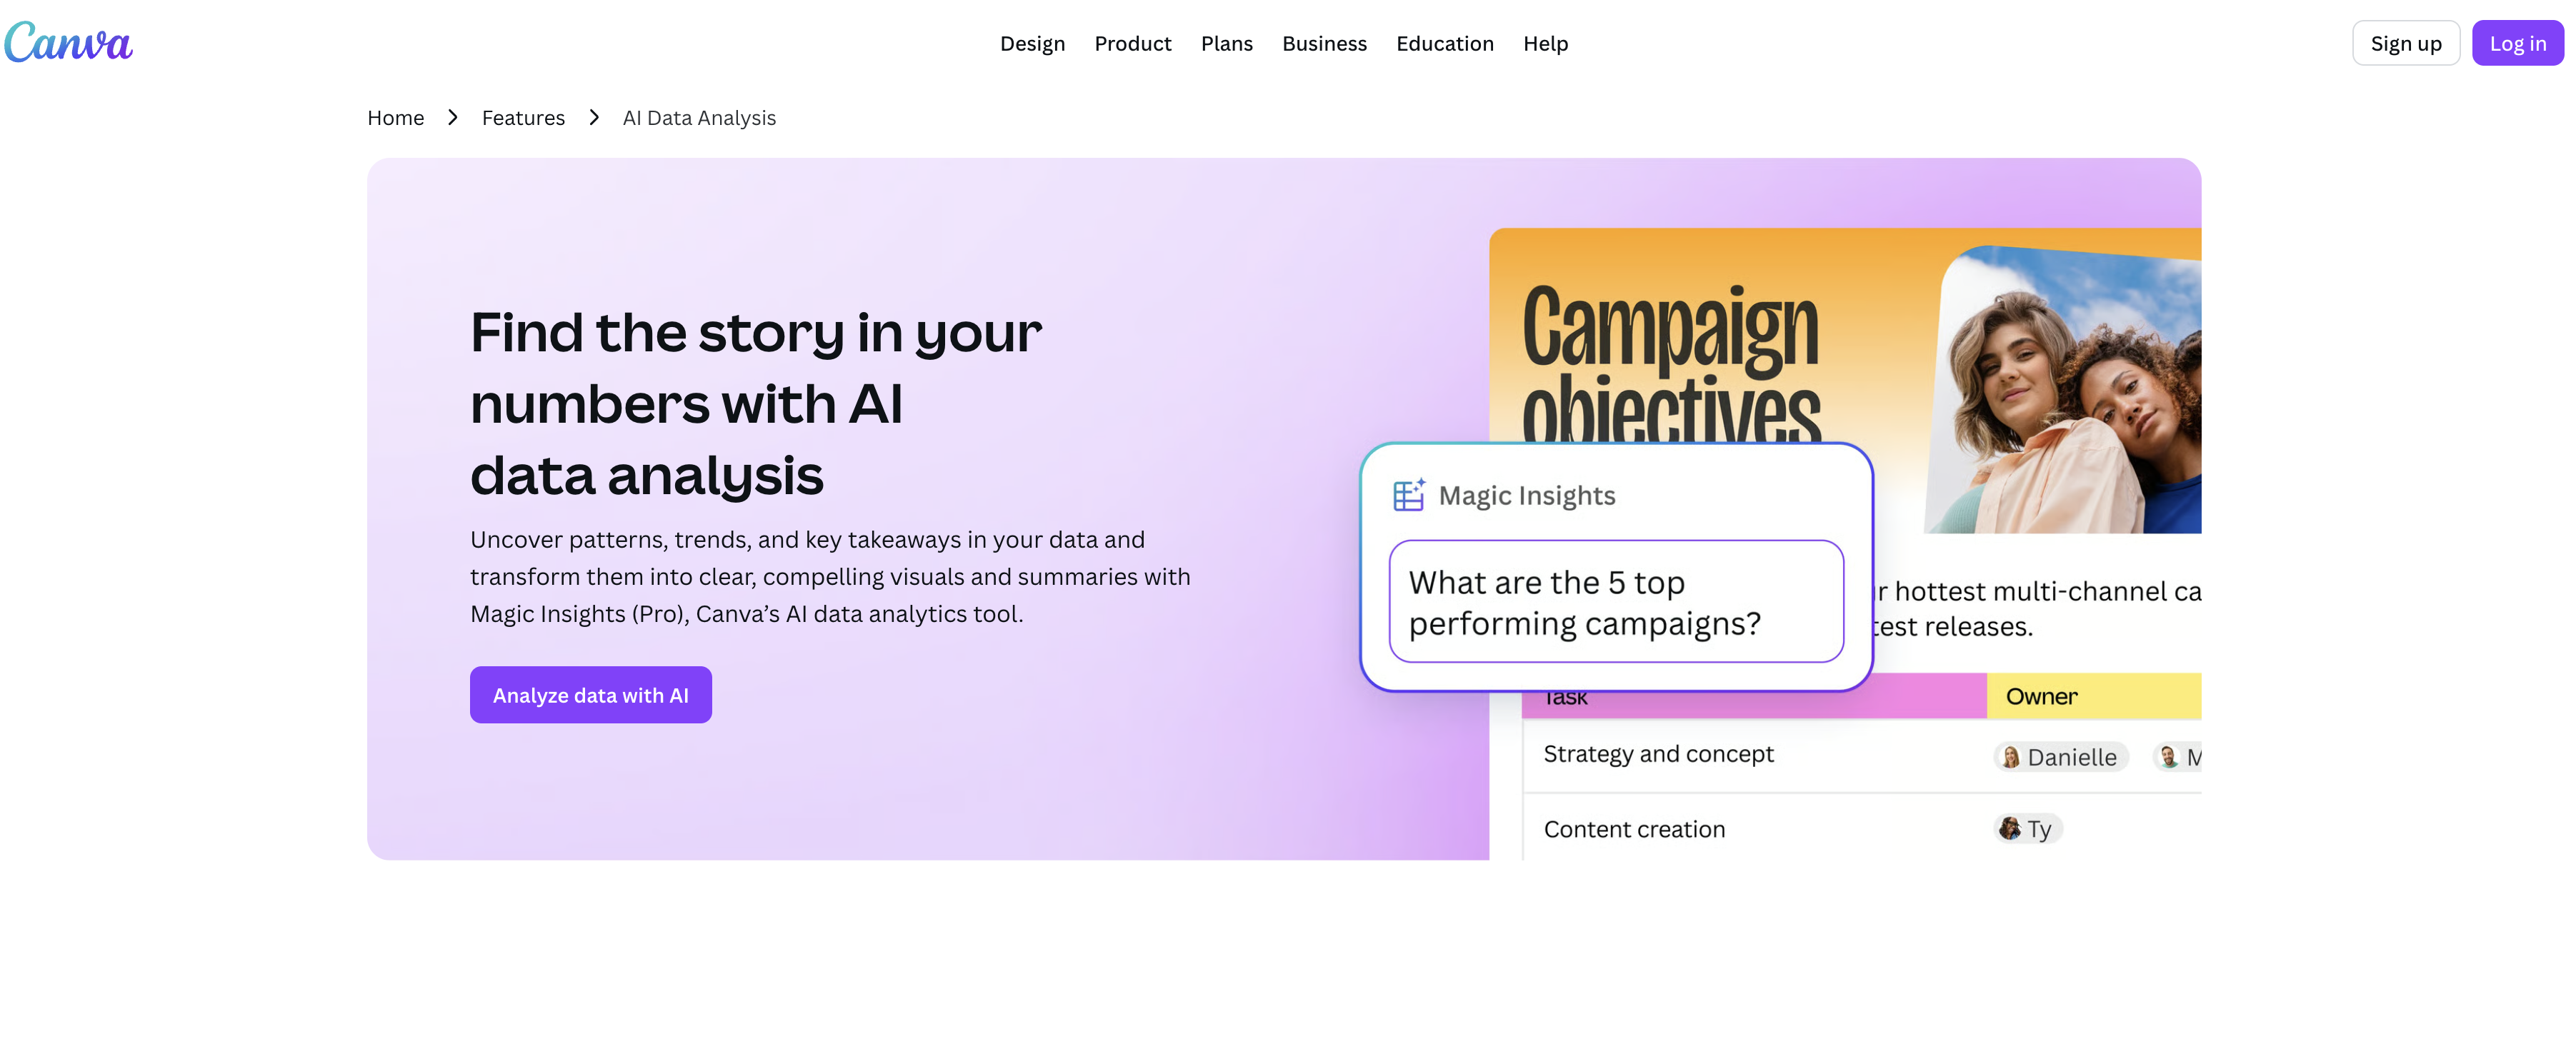
- Discover hidden patterns and trends in seconds without statistical expertise using AI-powered automatic data scanning and interpretation.
- Query your data in plain language and get detailed insights immediately, eliminating complex data query languages.
- Generate instant, visually compelling charts that communicate data stories clearly, ready for presentations or social posts.
- Apply insights and charts directly into any Canva design or layout, creating data-driven visuals without switching platforms.
- Identify the right formulas for your calculations automatically with the Magic Formulas feature for precise data computations.
- Work with any data set—business metrics, marketing stats, finance, or sales—whether logged or in raw form.
Pros & Cons
Pros
- Discover patterns and trends
- Transform data into graphics
- Automatically scans for insights
- Significantly reduces data interpretation time
- Plain language data query
- Provides insights within seconds
- Generates instant charts
- Charts integrate with Canva designs
- Applicable to presentations and social posts
- Magic Formulas locate suitable calculations
- Transform raw data into visuals
- Easy to operate
- Multiple practical features
- Ability to select data sets
- Directly apply insights to designs
- Instant charting
- Data-driven design
- Fast insight generation
- Canva Integration
- Data set selection
- Sheet or any other design integration
- Add charts to sheets
- Present summaries with key takeaways
- Can import data from third-party apps
- Copy and paste insights into designs
- Generate insights and charts simultaneously
- Suitable for multiple functions
- Option to instantly add chart to sheet
- Online data analysis
- Single question computation with Magic Formulas
- Customizable data visualizations
- Sheet upload from device or apps
- Interactive visuals creation
- App with Magic Formulas
Cons
- Limited to Canva integration
- Requires data set selection
- Dependent on plain language queries
- Doesn't support complex statistical analysis
- Browser compatibility issues
- Limited free usage credits
- Limited third-party app imports
- Limited chart customization
- Imprecise formula recommendation
- Data insights specific to design
Reviews
Rate this tool
Loading reviews...
❓ Frequently Asked Questions
Magic Insights is Canva's AI-driven data analysis tool. Its primary role is the analysis of data patterns to derive tangible insights for its users.
Primarily, Magic Insights parses and analyzes data to discover underlying patterns and trends, transforming this information into digestible summaries and visually appealing graphics. It also offers functionalities such as creating instant charts, suggesting formulas for calculations, and integrating the derived insights seamlessly into Canva designs.
To discover patterns in data, Magic Insights utilizes AI to automatically scan and interpret data without the need for manual interpretation or in-depth statistical knowledge. The AI engine identifies and correlates different data trends and patterns, presenting the same in a visually understandable fashion.
Yes, absolutely. Magic Insights is designed in such a way that you do not require in-depth statistical knowledge to use it. The tool automatically processes data, identifies key insights, summaries, and provides these data findings in a simple, understandable manner.
Magic Insights significantly reduces time for data interpretation by scanning and analyzing data automatically. With its capability to provide insights within seconds, it eliminates the need for manual perusal, hence, saving time and making data interpretation quicker and more efficient.
With Magic Insights, users are able to query their data in plain language. The AI engine of the tool interprets these queries and provides detailed insights in response to them.
Magic Insights generates instant charts that visually and effectively communicate data stories. These charts are designed keeping in mind aesthetic appeal as well as data comprehension requirements.
Magic Insights can be integrated into any Canva design or layout quite easily. The insights and charts created from data analysis can be directly applied to users' designs, thus enabling a seamless integration process.
Yes, Magic Insights can be utilized for various applications including presentations and social posts that require a data-driven approach. The data stories can currently be integrated into these applications easily.
Magic Formulas is another unique feature of Magic Insights that aids users in identifying suitable formulas for their data calculations. This feature makes it easier for users to make precise computations based on their existing data.
With Magic Insights, users can transform raw data into visually appealing charts using Magic Charts. This feature enables the creation of comprehensive and reader-friendly visuals for a better understanding of underlying data patterns.
Some of the most practical features of Magic Insights include data set selection, AI-powered insight generation, transformation of raw data into visual charts, formula suggestion, and the option to directly apply the insights to users' designs.
Magic Insights can work with a wide array of data sets. Whether the data is related to business metrics, marketing stats, finance or sales, the tool is capable of generating meaningful insights. Moreover, it can parse this data irrespective of whether it is logged or in raw form.
Magic Insights is designed to be easy-to-use and user-friendly. Operations are simplified with direct options to select a dataset, generate AI-powered insights, transform raw data into charts, and apply these insights onto Canva design elements.
Yes, one of the key features of Magic Insights is its ability to directly apply the generated insights to users' designs. This feature makes it easier for users to create data-focused designs without the necessity of alternating between multiple platforms.
Distinctive features of Magic Insights such as instant insight generation, ability to work with plain language queries, extensive integration with Canva designs, and overview of patterns and trends set it apart from other AI-driven data analysis tools.
An unprecedented advantage of Magic Insights is its ability to significantly reduce the time and effort required for data interpretation. By enabling users to input queries in plain language and providing visually compelling outputs instantly, it simplifies the otherwise complex process of data analysis.
Magic Insights proves beneficial in a variety of scenarios including but not limited to creating presentations with data-driven focus, locating suitable formulas for calculations, transforming raw data into visually appealing charts, and directly applying insights into Canva designs.
Support for beginners with Magic Insights is extensive. The platform is designed to be intuitive and user-friendly. In addition, how-to use guides, tutorials and help articles can be found on Canva's website for more comprehensive understanding of the tool.
For businesses, Magic Insights can provide instant and easily interpretable insights from their data, contributing to swifter and more informed decision making. Its ability to generate visually appealing charts and integrate seamlessly with other Canva designs makes it a comprehensive tool for businesses in their reporting, presentation, and planning processes.
Pricing
Pricing model
Pricing
Paid options from
N/A